Thermometer gauge, as the name implies, is used to display temperatures. The fill level of the thermometer indicates the temperature data that you wish to depict. The thermometer chart is a real-time gauge, which can update its data at every specified interval, without requiring any page refreshes.
In this section, you will be introduced to:
Basics of the thermometer gauge
Elements of thermometer gauge
Basics of the Thermometer Gauge
A sample FusionCharts Suite XT real-time thermometer gauge looks like this:
The thermometer gauge shown above is designed to work as the real-time temperature monitor for the Central Cold Store.
The thermometer gauge does NOT need a pre-defined color range. Instead, it takes in the fill color as an attribute and uses that color to fill up the thermometer.
Elements of Thermometer Gauge
A thermometer gauge consists of the following elements:
Thermometer Fill
Thermometer Border
Tick Marks
Chart value
Annotations
Before going into the details of each of them, take a look at a standard thermometer gauge with the elements labeled.
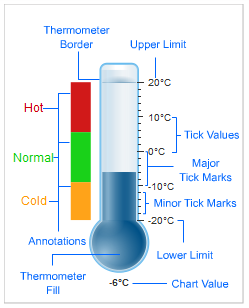
Thermometer Fill
The fill level in a thermometer gauge helps the end user to decipher the value being illustrated.
Thermometer Border
The thermometer can also have a border around it.
Tick Marks
Tick marks are the calibration marks on the vertical scale to the right of the thermometer to ease out the interpretation of the reading. There are two types of tick marks which can be drawn on the chart:
Major tick marks – These are the bigger lines on the tick mark scale.
Minor tick marks – These are the smaller lines enclosed within the bigger lines.
Value Display
The chart value display box displays the current temperature value indicated by the thermometer fill.
Annotations
Annotations allow you to draw your own custom shapes, text, or load images on the chart.
There! You have now seen the basic elements of the thermometer gauge.