FusionCharts Suite XT allows you to create individual floating text labels on the chart. This helps in defining a strict text content that can be shown and dragged anywhere on the chart. As of now, you can only add or delete a label, but you cannot edit a label.
In this section, you will be shown how you can:
Add a text label at run-time
Delete a text label at run-time
To understand this, the sample chart that we will use looks like this:
The above chart shows the US Subway Map and uses drag-able nodes to mark locations on the map.
The data structure needed to render the above chart is given below:
Adding a Text Label at Run-time
To add a new text label:
From the bottom-left corner of the chart, click the
 button. A menu is rendered.
From the menu, select the
Add a Labeloption.
The label properties dialog box, as seen in the image below, is shown:
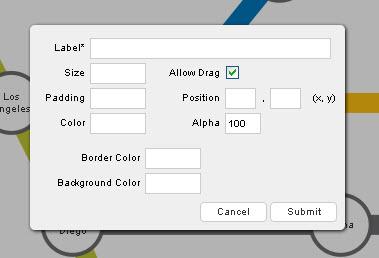
In the label properties dialog, enter the label information.
Click
Submit.
Given below is a brief description of the fields in this dialog box:
| Field | Description |
|---|---|
| Label | It is used to specify the text for the label. |
| Size | It is used to specify the size of the label. |
| Allow Drag | It is used to specify whether the label will be drag-able. Selecting this check-box will make the node drag-able (default), clearing it will not. |
| Padding | It is used to specify the space around the label. |
| Position | It is used to specify the x- and y-coordinates for the label position. |
| Color | It is used to specify the hex code for the font color of the label text. |
| Alpha | It is used to specify the label transparency. This field takes values between 0 (transparent) and 100 (opaque). |
| Border Color | It is used to specify the hex code for the label border color. |
| Background Color | It is used to specify the hex code for the label background color. |
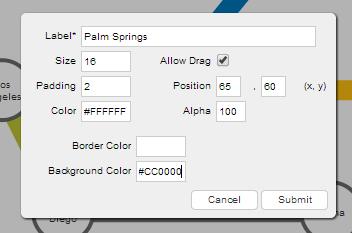
The image below shows the fields of the dialog box populated for a new label:
Now, when the Submit button is clicked, the new label created looks like this:
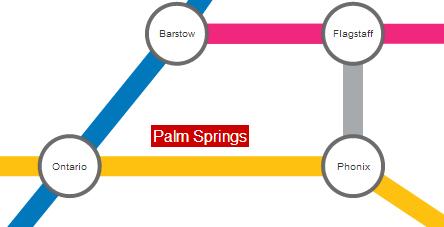
You can drag the label to any position on the chart.
You can define labels in chart data too. Each label is defined in the data of the chart through the object as the labels array element.
Event Raised
When a new label is created, a Javascript event, named labelAdded, is raised. You can trap and use this event to customize the output according to your requirements.
The code snippet required to trap this event is given below:
chartInstance.addEventListener(labeladded, function(e, a) {
    //Your code here
});
Deleting a Text Label at Run-time
To delete a text label:
- Press and hold the left mouse button on the label that you want to delete. A dialog box appears asking you to confirm the deletion.
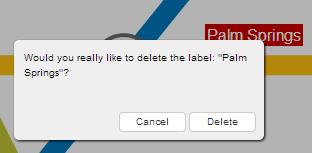
- From the dialog box, click
Delete. The label is deleted.
Event Raised
When a label is deleted, a Javascript event, named labelDeleted, is raised. You can trap and use this event to customize the output according to your requirements.
The code snippet required to trap this event is given below:
chartInstance.addEventListener('labeldeleted', function(e, a) {
    //Your code here
});
You can get the latest updated node and connector positions using JavaScript or by submitting the updated positions to a server-side script.
There! You have now seen how you can add and delete labels at run-time.