A heat map chart is a specialized chart that uses colors to represent data values in a table. It is mostly used to plot large and complex data.
In this section, you will be introduced to the:
Basics of heat map charts
Key features
Types of heat map charts
Legends in heat map charts
Basics of Heat Map Charts
You can use the heat map chart to plot data like employee attendance, a periodic table, tracking investments in the stock market, comparing the performance of different companies, etc. You can set different colors for different levels of data. For example, you can use the heat map chart to plot the employee attendance and use the red, yellow, blue and green color to indicate a bad, average, good, and excellent, respectively, percentage of employee attendance. When the chart is rendered the four levels can be easily distinguished by their respective colors.
Key Features
Salient features of the heat map chart include:
Data is arranged in a tabular format containing a finite number of rows and columns
Both numeric and non-numeric data can be plotted
A solid color or a gradient color can be used to display a range of values
Interactive legend is used to show or hide data plots
Any data which is not mapped by the defined color range remains hidden
There are two types of legends : icon legend and gradient legend
Types of Heat Map Charts
FusionCharts Suite XT includes two types of heat map charts:
Numeric heat map chart: It is used to plot numeric data.
Category-based heat map chart: It is used to plot non-numeric data.
Numeric Heat Map Chart
A simple numeric heat map chart looks like this:
Category-based Heat Map Chart
A simple category-based heat map chart looks like this:
Legends in Heat Map Charts
Heat map charts allow you to display two types of legends:
Gradient legend
Icon legend
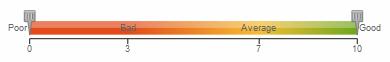
Gradient Legend
A simple gradient legend looks as shown in the image below:
Icon Legend
A simple icon legend looks as shown in the image below:

There! You have now seen and understood the basic features, types, and the legends used for a heat map chart.