An LED Gauge is essentially similar to an angular gauge chart but with a horizontal/vertical scale instead of a circular one. It uses bars that change color, or marks out different regions in different colors to indicate whether data is within preset parameters. The colors can be selected to suit the application such as green for satisfactory, yellow for caution, and red for alarm.
LED gauges are of two types - horizontal LED gauges and vertical LED gauges. As the name suggests, the horizontal LED gauge has the bar placed horizontally while the vertical LED has it vertically. LED Gauges are used in financial applications like management dashboards, factory operation output reports, etc.
In this section, you will be introduced to the:
Basics of LED gauges
Elements of LED gauges
Basics of LED Gauges
The LED gauge (horizontal/vertical) is defined by its minimum and maximum values. Within that scale you can create various ranges to classify your data. For example, you might define a range called "Best" that consists of values between 60 and 100. Or you might define a range called “Weak” that consists of values between 30 and 60. For each range, you define a color, which helps visually distinguish the ranges from each other.
A horizontal LED gauge rendered to indicate the fuel levels looks like this:
Similarly, a vertical LED gauge rendered to indicate the fuel levels looks like this:
Elements of LED Gauges
An LED gauge consists of the following elements:
Gauge (Color Range Scale) with border
LED bars and gaps
Tick marks and tick values
Chart value
Annotation
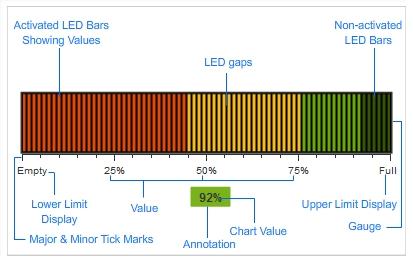
The image below shows a standard horizontal LED gauge with the basic elements of the gauge labeled.
Color Range
The LED gauge is defined by minimum and maximum values. Within that scale you can create various ranges to classify your data. There can be any number of ranges as you require to have. For each range, you will have to specify the minimum and maximum limits, a name for the range (that can be rendered as the label for the range), and the hex code for the color to be used for the range.
In the sample LED gauges shown above, the lower limit is 0 and the upper limit is 100. The range limits and the colors for each range have been defined as:
0-45: #e44a00
45-75: #f8bd19
75-100: #6baa01
LED Bars and Gaps
The LED bars are the actual data indicators in an LED gauge. The LED bars fill up the LED container in a ratio that suggests the chart value.
Tick Marks
Tick marks are the calibration marks on the horizontal (or vertical for the vertical LED) scale to help interpret the reading. There are two types of tick marks which can be drawn on the chart:
Major tick marks – These are the bigger lines below the scale.
Minor tick marks – These are the smaller lines enclosed within the bigger lines.
Chart Value
The chart value indicates the value of the gauge in numeric terms.
Annotations
Annotations allow you to draw your own custom shapes, text, or load images on the chart.
There! You have now seen and understood the elements of a simple LED gauge.