Vertical (or horizontal in case of bar charts) separator lines or vlines are elements that can differentiate between data blocks in a chart. They can be placed between any two data points, or aligned to specific data points.
This section talks about:
Configuring positions of vertical lines
Configuring labels for vertical lines
Customizing vertical line display properties
Configuring label borders
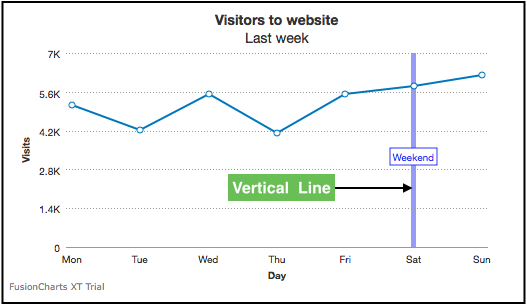
Configuring position of vertical lines
You can configure the position where a vertical line will be rendered. A line chart with a vertical line displayed between the Friday and Saturday data points looks as below:
Given below is the list of attributes used to configure position of vertical separator line:
| Attribute | Description |
linePosition |
It is used to specify the relative position of the vertical line with value ranging from 0 to 1. If a vertical line is to be plotted between two data points, then the first point is ‘0’ and the second point is ‘1’. By default, it is ‘0.5’ to show it between the points. |
vLine |
Set this to 1 to show vertical line or 0 to hide it. |
The data structure used, in the chart above, to configure vertical lines is as follows:
Configuring labels for vertical lines
Creating labels
A line 2D chart with a label ("weekend") for the vertical line between the columns for Friday and Saturday looks as below:
Given below is the attribute used to create labels for a vertical separator line:
| Attribute | Description |
label |
It is used to specify the title of the specified vertical line. |
The data structure needed to add a label for vertical line is given below:
Configuring label positions
A line chart with the label position configured to show along the middle of the vline looks as below:
Given below is the attribute used to set label position for vertical lines:
| Attribute | Description |
labelPosition |
It is used to specify the relative position of the label of the vertical line with value ranging from 0 to 1. In vertical charts, 0 means top of canvas and 1 means bottom. In horizontal charts, 0 means left of canvas and 1 means right. |
The data structure used, in the above chart, to configure label position for vertical lines is given below:
Configuring label alignment
A line chart with a customized label alignment looks as below:
Note that, in the first chart, the label for the vertical line is vertically aligned to the top and horizontally aligned to the left. In the second chart, the label for the vertical line is vertically aligned to the bottom and horizontally aligned to the right.
Given below is a brief description of the attributes used to align the label for a vertical line:
| Attribute | Description |
labelHAlign |
It is used to specify the horizontal anchor point for a vLine label. The possible values for this attribute are left, center (default), and right. |
labelVAlign |
It is used to specify the vertical anchor point for a vLine label. The possible values for this attribute are top, middle (default), and bottom. |
The data structure needed to configure label alignment is given below:
Customizing vertical line display properties
A line chart with the appearance of the vertical line customized (in this case: dashed appearance) looks as below:
Given below is the list of attributes used to customize the appearance of a vertical line:
| Attribute | Description |
color |
If specifies the hex code for the color that will be used to render the vertical line. e.g. #00ffaa. |
thickness |
Sets the thickness of the vertical line(in pixels). |
alpha |
Sets the transparency of a vertical line. Can take values from 0 (transparent) to 100 (opaque). |
dashed |
Set this to 1 to make vertical line dashed or 0 (default) to make them normal. |
dashLen |
Sets the length of each dash of a vertical line(in pixels). |
dashGap |
Sets the gap between two consecutive dashes in a vertical line (in pixels). |
The data structure used, in the chart above, to customize a vertical line is given below:
Configuring label borders
A line chart rendered without a border for the label of the vertical line looks as below:
Given below is the list of attributes used to turn the label border on or off:
| Attribute | Description |
showVLineLabelBorder |
It is used to specify whether to display the label border for all vertical lines. The attribute can be set at the chart object level. |
showLabelBorder |
It is used to specify whether to display the label border for a specific vertical line. This attribute can be configured for a specificvLine and overrides the setting in the chart object. |
The data structure used, in the chart above, to configure label border for vertical lines is as follows: