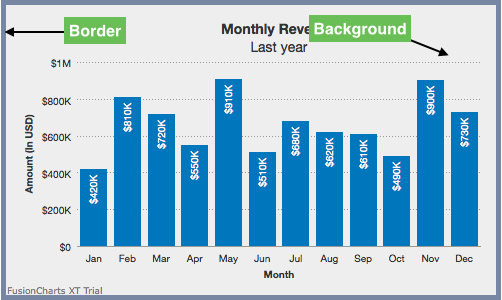
A chart's background refers to the whole area on which a chart is drawn. The background of the chart is enclosed by a chart border. The chart border is a rectangle around the chart background.
This article will show you how to configure your charts with respect to its border and background. It will explain a few attributes that control the behaviour of the chart border and background.
This section is divided into the following parts:
Customizing chart border
Customizing chart background
Using gradient fill for the background
Using an external image as the background
Customizing background image
Customizing chart borders
2D charts in FusionCharts Suite XT have a default border. 3D charts don't have a default border but you can include one.
A column 2D chart with a customized border looks as below:
Given below is a brief description of the attributes used to customize chart border:
| Attribute Name | Description |
showBorder |
It is used to specify whether a border should be shown around the chart. Setting this attribute to 1 (default for 2D charts) shows a border around the chart. Setting it to 0 (default for 3D charts) hides it. |
borderColor |
It is used to specify the hex code of the color to be applied to the chart border. The hex code should be prefixed with the # character. |
borderThickness |
It is used to specify the thickness of the chart border. |
borderAlpha |
It is used to specify the transparency of the chart border. The value can range from 0 to 100 where 0 is completely transparent and 100 is completely opaque. |
The data structure needed to customize the chart borders, using these attributes, is given below:
Customizing chart background
Background here refers to the complete area inside the chart border.
A column 2D chart with a customized background color looks as below:
Below is the list of attributes that can be used to customize chart background:
| Attribute Name | Description |
bgColor |
It is used to specify the hex code for the color to be applied to the chart background. The hex code should be prefixed with the # character. |
bgAlpha |
It is used to set the transparency for the chart background. |
The data structure required to customize the chart background is as shown below:
Using gradient fill for the background
When using a gradient fill for the background, you can configure three aspects:
Set gradient transparency
Set ratio of colour distribution
Set the gradient angle.
A column 2D chart with a gradient fill used in the background looks as below:
Below is the list of the attributes used to customize gradient fill for chart background:
| Attribute Name | Description |
bgColor |
It is used to specify the hex code of all colors to be used for the gradient. The codes should be separated by a comma. |
bgAlpha |
It is used to set the transparency for each color specified in the bgColor attribute. The values for alpha for individual colors should be separated by a comma. If the number of alpha value is less than the number of colors specified, the last alpha value is re-used for the remaining colors. |
bgRatio |
It is used to specify the ratio of each color in the gradient. The sum of the ratio values specified using this attribute should equal to 100. If the number of ratio value is less than the total number of colors specified, the remaining colors are equally distributed in the unallotted area. |
The data structure required to customize the chart background with a gradient fill is as shown below:
Using an external image as chart background
You can specify an external image (GIF, JPEG or PNG only) as the background of the chart.
Shown below is a chart with an external image used as its background:
The attribute to use an external image as chart background is mentioned below:
| Attribute Name | Description |
bgImage |
It is used to specify the URL of the image to be used for the background. |
The data structure required to use an external image as the chart background is as shown below:
Customizing the background image
You can customize the external image rendered as the chart background. FusionCharts Suite XT lets you to:
Specify the transparency level of the background image
Specify a display mode
Set the alignment of the image
Set the scale of the image
A column 2D chart with a partially transparent background looks as below:
Below is the list of attributes used to customize a chart image background:
| Attribute Name | Description |
bgImage |
It is used to specify the URL of the image to be used for the background. |
bgImageAlpha |
It is used to specify the transparency for the background image. |
bgImageVAlign, bgImageHAlign |
These are used to align the image vertically and horizontally, respectively. Possible values for these attributes are top, middle and bottom. |
bgImageScale |
It is used to increase or decrease the scale of the image. Possible values of this attribute lie between 0-300. When 300 is specified the image is 300% magnified, whereas 0 will reduce the image to an invisible entity. 100 will produce the image with actual or 100% size. Anything lower than 100 will reduce the size of the image. |
bgImageDisplayMode |
It is used to specify the mode in which the background image is to be displayed. Possible values are stretch, tile, fit, fill, center and none. |
Alignment attributes are ignored for center and stretch display modes and bgImageScale attribute works only for none, center and tile display modes.
The data structure required to customize the transparency of external image rendered as the chart background is as shown below: