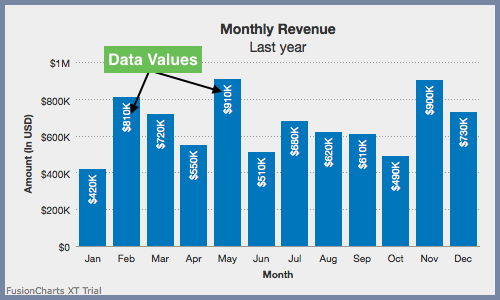
Data values are plot values i.e. values of each data plot (line, column, bar, pie) displayed on the chart.
This section talks about:
Configuring text labels instead of numeric data values
Configuring rotation of data values
Configuring placement of data values
Configuring display of data values
Customizing data value properties
Configuring text labels instead of numeric data values
Instead of displaying numeric data values, you can use text labels to denote data values for each data item.
A column 2D chart with custom text instead of numeric data values looks as below:
Given below is the attribute used to configure text as the data value:
| Name | Description |
displayValue |
Used to display a custom text instead of the numerical value of data. |
The data structure needed to configure text as the data value is given below:
Configuring rotation of data values
You can display data values in the following modes:
Normal mode
Rotated mode
Normal Mode
In the normal mode, you can display data values horizontally as shown below:
Rotated Mode
In the rotated mode, you can rotate data values in a chart as shown below
Given below is the attribute used to rotate data values in the chart:
| Name | Description |
|---|---|
rotateValues |
Set to 1 to rotate data values and 0 to keep them horizontal. |
The data structure needed to rotate data values is shown below:
Configuring placement of data values inside columns
You can place data values inside a chart and you can also rotate it for better clarity.
A column 2D chart with data values placed inside columns looks as shown below:
Given below is the attribute used to place data values inside columns:
| Name | Description |
|---|---|
placevaluesInside |
Set this to 1 to show data values inside the column or to 0 to show values outside. By default, the chart tries to show the values outside the column. |
The data structure needed to place values inside columns is given below:
Configuring display of data values
You can display specific data values as described in this sub-section.
A column 2D chart with specific data values placed inside columns looks as below:
Given below is the attribute used to display only specific data values:
| Name | Description |
showValues |
Set it to 1 to show all data values in a chart and to 0 to hide it. |
showValue |
Set it to 1 to show a particular data value and to 0 to hide it. This setting overrides the showValues setting at the chart object level. |
The data structure needed to place values inside columns is given below:
Skipping y-axis values
If there are a large number of values to be displayed along the y-axis, FusionCharts Suite XT allows you to display only every nth y-axis value.
A column 2D chart with y-axis values skipped to render only alternate values looks as below:
Given below is the attribute used to skip y-axis values:
| Attribute | Description |
yAxisValuesStep |
Setting this variable to n will show the first value (from bottom) and every n-th value after that. e.g., a chart showing data for 12 months and set with yAxisValuesStep: 3 will show labels for January, April, July and October. The rest of the values will be skipped.
This attribute can also assume default values based on the space available in the chart to render y-axis values, and can override the values provided to avoid overlapping of y-axis values. |
The data structure used, in the chart above, to skip y-axis values is given below:
Customizing data value properties
You can customize the data value properties in terms of font, border, background, and alpha. Let us understand each of them in detail.
Font Properties
A column 2D chart with a blue color font and other customizations applied, looks as below:
Given below is the list of attributes used to customize the font for data values:
| Name | Description |
valueFont |
Sets the font family for data-values, e.g. Arial |
valueFontColor |
Sets the font color for data-values in hex code, eg. #00ffaa |
valueFontSize |
Specifies the data-value font size, with a range of 0 to 72. |
valueFontBold |
1 (default) sets font to bold and 0 sets it to normal. |
valueFontItalic |
1 italicizes the font and 0 (default) sets it to normal. |
valueAlpha, valueFontAlpha |
Sets the transparency for text, background and border of the data values. Value ranges from 0(transparent) to 100(opaque). |
The data structure needed to customize the data values font is given below:
Customizing data value border
A Pie 2D chart with a dashed border around the data values looks as below:
Given below is the list of attributes used to customize the border for data values:
| Name | Description |
valueBorderColor |
Sets the color of border around data value in hex code, eg. #00ffaa |
valueBorderAlpha |
Sets the transparency of border of the data values. Value ranges from 0(transparent) to 100(opaque). |
valueBorderThickness |
Sets data-value border thickness(in pixels). |
valueBorderRadius |
Sets data-value border radius(in pixels). |
valueBorderDashed |
1 makes data-value border dashed and 0 sets it to normal (default). |
valueBorderDashGap |
Sets the gap between two consecutive dashes of data-value border (in pixels). |
valueBorderDashLen |
Sets the length of each dash in data-value border (in pixels). |
valueBorderHoverAlpha |
Sets the value border alpha on hover |
The data structure needed to customize the data values borders is given below:
Customizing data value background
A Pie 2D chart with background properties for data values applied looks as below:
Given below is the list of attributes used to customize the background for data values:
| Name | Description |
valueBgColor |
Sets the background color of data value text in hex code, eg. #00ffaa |
valueBgAlpha |
Sets the transparency of text-background of the data values. Value ranges from 0(transparent) to 100(opaque). |
valueBgHoverAlpha |
Sets the value background alpha on hover |
The data structure needed to customize the data values background, is given below: