Drag-node Chart - Adding and Editing Connectors
FusionCharts Suite XT allows you to customize a drag-node chart at run-time - you can add, edit, or delete connectors in a drag-node chart. Set the chart to edit mode to use this feature (edit mode can be enabled by setting "viewMode: 0" in the chart object).
In this section, you will learn how to:
Add a connector at run-time
Edit a connector at run-time
Delete a connector at run-time
To understand this, the sample chart that we will use looks like this:
The above chart shows the US Subway Map and uses drag-able nodes to mark locations on the map.
The data structure needed to render the above chart is given below:
Adding a Connector at Run-time
In the above chart, the "My Edited Connection" node does not have any connectors connecting it to the other nodes on the chart. We will add a connector that will connect this node to the node representing Santa Monica.
To add a connector:
From the bottom-left corner of the chart, click the
 button. A menu is rendered.
From the menu, select the
Add a Connectoroption.

The connector properties dialog box, as seen in the image below, is shown:
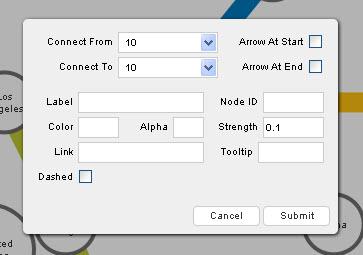
In this dialog box, enter the connector information.
Click
Submit.
Given below is a brief description of the fields in this dialog box:
| Field | Description |
|---|---|
| Connect From | It is used to specify the source node for the connector. |
| Connect To | It is used to specify the destination node for the connector. |
| Arrow At Start | It is used to specify whether an arrow, pointing towards the source node, will be rendered. Selecting this check box will show the arrow, clearing it will not show it. |
| Arrow At End | It is used to specify whether an arrow, pointing towards the destination node, will be rendered. Selecting this check box will show the arrow, clearing it will not show it. |
| Label | It is used to specify the label for the connector. The label will be displayed on the chart. |
| Node ID | It is used to specify the unique ID of the node to be added. |
| Color | It is used to specify the hex code of the color that will be used to render the connector. |
| Alpha | It is used to specify the transparency for the connector. This field takes values between 0 (transparent) and 100 (opaque). |
| Strength | It is used to specify the strength of the connector. This field takes values between 0 and 2. The value entered here is multiplied by the thickness specified for the connector (using the stdThickness attribute). |
| Link | It is used to specify the URL to which the user will be redirected if the connector is clicked. |
| Tooltip | It is used to specify the tool-tip text for the connector. |
| Dashed | It is used to specify whether the connector will be rendered as a dashed line. Selecting this check box will render the connector as a dashed line, clearing it will render it as a whole line. |
| Dash Gap | It is used to specify the gap between each dash, if the connector is rendered as a dashed line.
This field is visible only when you have selected the |
| Dash Length | It is used to specify the length of each dash, if the connector is rendered as a dashed line.
This field is visible only when you have selected the |
The image below shows the fields of the dialog box populated for a new connector:
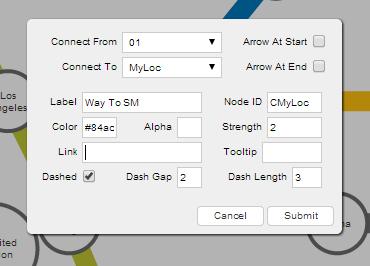
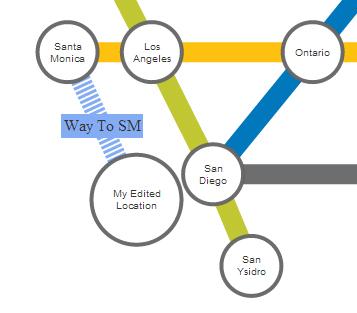
Now, when the Submit button is clicked, the new connector created looks like this:
You can define connectors in chart data too. Each connector line is defined in the data of the chart as an object in the connectors array element.
Event Raised
When a new connector is created, a Javascript event, named connectorAdded, is raised. You can trap and use this event to customize the output according to your requirements.
The code snippet required to trap this event is given below:
chartInstance.addEventListener('connectoradded', function(e, a) {
    //Your code here
});
Editing a Connector at Run-time
For a connector, you can edit all its properties except for the source and destination nodes.
To edit a connector:
Press and hold the left mouse button on the connector to be edited. The connector properties dialog box is rendered with the
Connect ToandConnect Fromfields disabled.In this dialog box, re-populate the fields you want to edit.
Click
Submit.
The image below shows the fields of the dialog box re-populated to edit the connector:
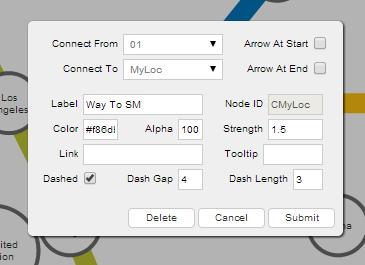
The edited connector looks like this:

Event Raised
When a connector is edited, a Javascript event, named connectorUpdated, is raised. You can trap and use this event to customize the output according to your requirements.
The code snippet required to trap this event is given below:
chartInstance.addEventListener('connectorupdated', function(e, a) {
    //Your code here
});
Deleting a Connector at Run-time
To delete a connector:
Press and hold the left mouse button on the connector to delete. The connector properties dialog box appears.
From the dialog box, click
Delete. The connector is deleted.
Event Raised
When a connector is deleted, a Javascript event, named connectorDeleted, is raised. You can trap and use this event to customize the output according to your requirements.
The code snippet required to trap this event is given below:
chartInstance.addEventListener('connectordeleted', function(e, a) {
    //Your code here
});
You can get the latest updated node and connector positions using JavaScript or by submitting the updated positions to a server-side script.
There! You have now seen how you can add, edit and delete connectors at run-time.