One of the simplest gauges available in the FusionCharts Suite XT v3.4, the bulb gauge is used to indicate a specific dataset by utilizing a circle that indicates whether the monitored data is within defined limits and if it is, then which limit does it belong to. Colors for the bulb can be selected to suit the application such as green for satisfactory, yellow for caution, and red for alarm.
In this section, you will be introduced to the:
Basics of bulb gauge
Elements of bulb gauge
Basics of the Bulb Gauge
The bulb gauge is one of the simplest charts in all. It is used in a variety of applications including financial dashboards, machine controller screens etc., where a single value or state indicator is required.
A simple bulb gauge rendered to indicate the temperature status of deep freezers looks like this:
The gauge is defined by minimum and maximum values. Within that scale you can create various ranges to classify your data. Depending on the range that the data value belongs, the bulb color changes and the display value is set accordingly.
Elements of the Bulb Gauge
A bulb gauge consists of the following elements:
Bulb (which changes color to indicate data value)
Value textbox
Before going into the details of each of them, let us have a look at a bulb gauge with the basic elements labeled:
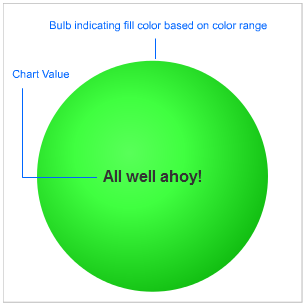
Color Range
On a bulb gauge scale, you can create any number of ranges to classify your data. For each range, you will have to specify the minimum and maximum values, a name for the range that will be displayed as the label, and the hex code for the color that will used to indicate the range.
Note: Each color range should have its own unique range index. For example, if a range is defined as 0-50, the next range should have the minimum value as 50 necessarily. Similarly, if the upper limit of the chart is 100, the last range should have max value as 100 for the chart to function properly.
Value Textbox
The value textbox helps you show the value indicated by the gauge in numeric terms or you can show the color range label as value for showing current status. You can also opt to hide it.
There! You have now seen and understood the elements of a simple bulb gauge.