Drag-node charts let you update data in real-time. To access the updated JSON data at the client-side using JavaScript, you can parse this data and update your data sources through AJAX, etc.
In this section, you will be shown how you can read the updated data using JavaScript functions present on the same page.
Once the chart is rendered, to access the chart’s updated data as JSON, simply call the getJSONData() function on the chart.
The code snippet to do this is given below:
//Get a reference to our chart
var ourChart = FusionCharts("NodeChart");

//Get the data from chart
var jsonRtn = ourChart.getJSONData();

//Show it to user in alert box.
alert(JSON.stringify(jsonRtn));
The function getJSONData() returns the latest or changed data. This function is also used to retrieve the original data from the chart. To get the original data from the chart you need false as a parameter to the function. For example, var jsonRtn = ourChart.getJSONData(false);
To understand this, the sample drag-node chart we will use looks like this:
The data structure needed to render this chart is given below:
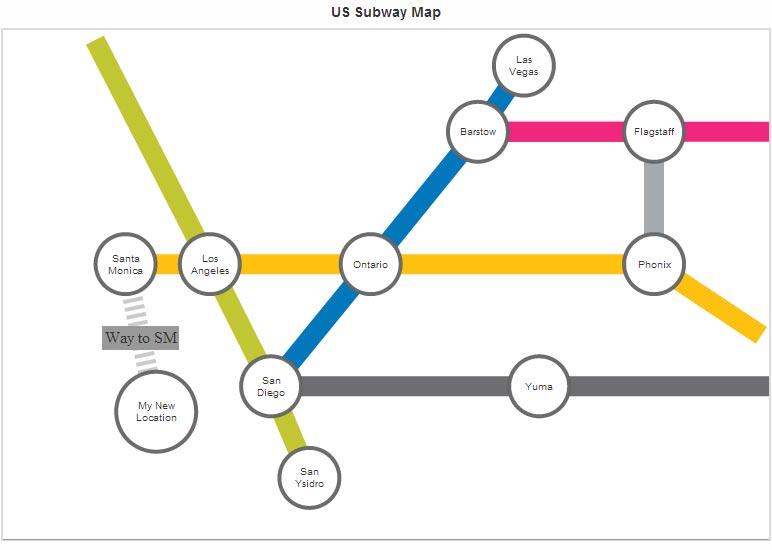
Now, we will make the following updates to this drag-node chart:
Add a node named "My New Location" using "Add a Node" menu.
Add a connector between "Santa Monica" and "My New Location" and named "Way to SM" using "Add a Connector" menu
To make these updates, refer to the Adding and Editing Nodes and the Adding and Editing Connectors sections.
The drag-node chart rendered after making these updates looks like this:
Now if you wish to get the current data using the code var jsonRtn = ourChart.getJSONData(); alert(JSON.stringify(jsonRtn));, the updated data will be shown. The modified part of the updated data is shown below:
{
    "chart": {
            ...
    },
    "dataset": [{
        "data": [
            ...
            {
                "x": "20",
                "y": "25",
                "id": "myLoc",
                "datasetId": "0",
                "name": "My New Location",
                "tooltext": "My Location",
                "color": "#FFFFFF",
                "alpha": "100",
                "labelalign": "middle",
                "allowdrag": 1,
                "shape": "circle",
                "width": "",
                "height": "",
                "radius": "40",
                "numsides": "",
                "imagenode": 0,
                "imagewidth": "",
                "imageheight": "",
                "imagealign": "",
                "imageurl": "",
                "link": "http://www.fusioncharts.com"
            }
        ]
    }],
    "connectors": [{
        ...
        {
            ...
        },
        ...
        {
            "from": "myLoc",
            "to": "01",
            "id": "",
            "label": "Way to SM",
            "color": "#999999",
            "alpha": "50",
            "link": "",
            "tooltext": "",
            "strength": "2",
            "arrowatstart": "0",
            "arrowatend": "0",
            "dashed": "1",
            "dashlen": "4",
            "dashgap": "4"
        }
    ]},
    "labels": {
        "label": []
    }
}
There! You have now seen how you can get updated data from a drag-node chart using JavaScript.