Loading
Exporting Charts and Chart Data using Client-side Export
Harry has created charts comparing vendor quotations for a very critical project. To add his charts to a project-progress presentation, he needs the charts as JPEGs. So far, he has used the FusionCharts server-side export feature to export his charts as images. However this time, because his data is crtical and confidential, he is not sure if he should use a publicly-hosted server for this export. While he can set up a private export server to export images, this requires extensive efforts and domain expertise.
To his relief, FusionCharts Suite XT, starting v3.8.0, includes support for client-side exporting, which also eases Harry’s concerns about data confidentiality.
While FusionCharts has an established server-side exporting feature, common concerns with this feature include:
- Availability of a good internet connection to send to and receive from the server
- Confidentiality concerns around using the publicly hosted export server.
FusionCharts does provide programs to set up the export server at a client’s end, but this requires the end user(s) to have a certain amount of knowledge about configuring and using servers. This, again, is a downside.
The primary need for coming up with the client-side export feature was to eliminate the need of a server for exporting, thus bringing down the turnaround time it takes for an export, as well as to to address the data confidentiality issues. The client-side export feature removes the round-trip involved in exporting from a server and eliminates the difficulties involved in setting up one with the proper dependencies.
To enable the client-side export feature for your application, all you need to do is set the exportEnabled and the exportAtClientSide (since v3.8.0) attributes to 1 and you are good to go.
Please note that, at present, this feature is supported only by the Chrome and Firefox browsers. The FusionCharts team is working to include support for other browsers also.
The sample chart below showcases the client-side export feature. As with server-side export, click  from the top-right corner of the chart and select Download as JPEG.
{
    "chart": {
        "caption": "Monthly revenue",
        "subCaption": "Last Year",
        "xAxisName": "Month",
        "yAxisName": "Revenues",
        "exportEnabled": "1",
        "numberPrefix": "$",
        "theme": "fint"
    },
    "data": [
        {
            "label": "Jan",
            "value": "420000"
        },
        {
            "label": "Feb",
            "value": "810000"
        },
        {
            "label": "Mar",
            "value": "720000"
        },
        {
            "label": "Apr",
            "value": "550000"
        },
        {
            "label": "May",
            "value": "910000"
        },
        {
            "label": "Jun",
            "value": "510000"
        },
        {
            "label": "Jul",
            "value": "680000"
        },
        {
            "label": "Aug",
            "value": "620000"
        },
        {
            "label": "Sep",
            "value": "610000"
        },
        {
            "label": "Oct",
            "value": "490000"
        },
        {
            "label": "Nov",
            "value": "900000"
        },
        {
            "label": "Dec",
            "value": "730000"
        }
    ]
}
<html>
<head>
<title>My first chart using FusionCharts Suite XT</title>
<script type="text/javascript" src="http://static.fusioncharts.com/code/latest/fusioncharts.js"></script>
<script type="text/javascript" src="http://static.fusioncharts.com/code/latest/themes/fusioncharts.theme.fint.js?cacheBust=56"></script>
<script type="text/javascript">
FusionCharts.ready(function(){
var fusioncharts = new FusionCharts({
type: 'column2d',
renderAt: 'chart-container',
width: '500',
height: '300',
dataFormat: 'json',
dataSource: {
"chart": {
"caption": "Monthly revenue",
"subCaption": "Last Year",
"xAxisName": "Month",
"yAxisName": "Revenues",
//Making the chart export enabled in various formats
"exportEnabled": "1",
"numberPrefix": "$",
"theme": "fint"
},
"data": [{
"label": "Jan",
"value": "420000"
}, {
"label": "Feb",
"value": "810000"
}, {
"label": "Mar",
"value": "720000"
}, {
"label": "Apr",
"value": "550000"
}, {
"label": "May",
"value": "910000"
}, {
"label": "Jun",
"value": "510000"
}, {
"label": "Jul",
"value": "680000"
}, {
"label": "Aug",
"value": "620000"
}, {
"label": "Sep",
"value": "610000"
}, {
"label": "Oct",
"value": "490000"
}, {
"label": "Nov",
"value": "900000"
}, {
"label": "Dec",
"value": "730000"
}]
}
}
);
fusioncharts.render();
});
</script>
</head>
<body>
<div id="chart-container">FusionCharts XT will load here!</div>
</body>
</html>How do you know if the export was done on the client-side? The images below show you the difference:
| |
|
|---|---|
|
|
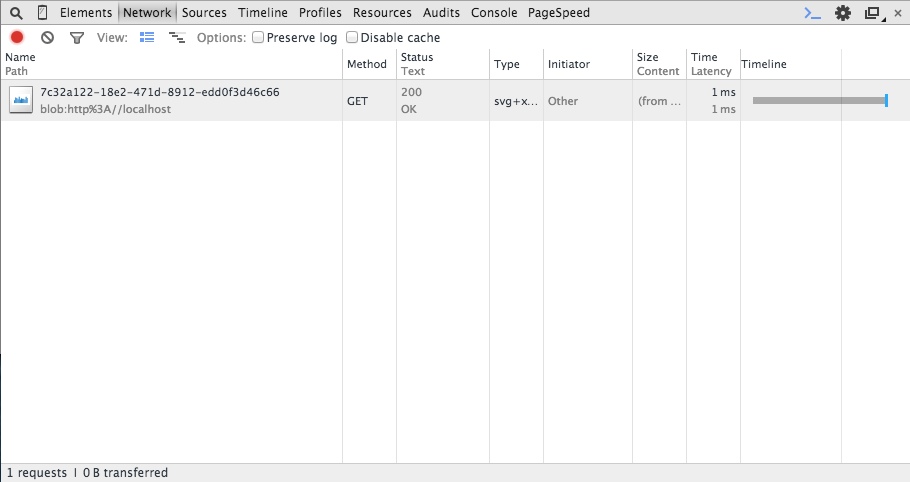
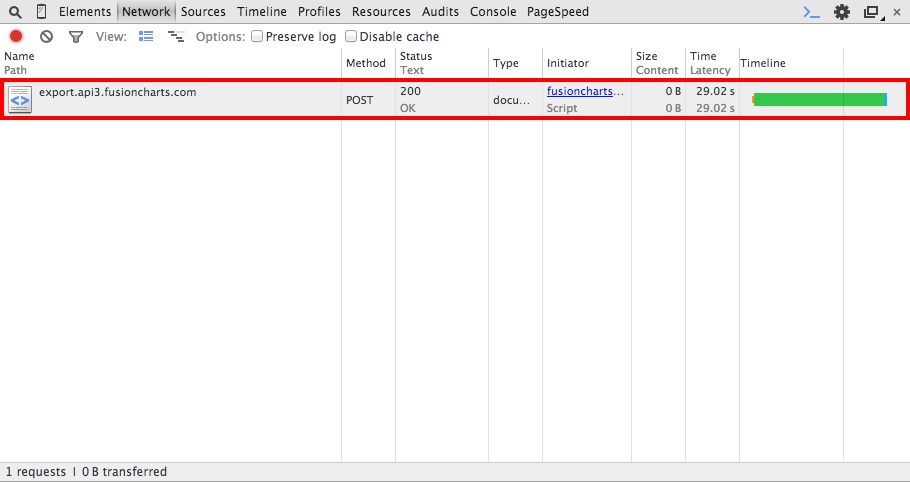
The graphic below details the steps that are involved in a client-side export:
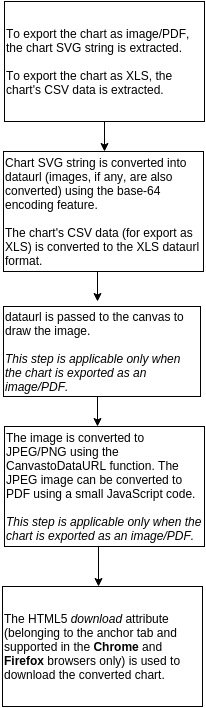
Because the feature uses the HTML5 API, it is important that modern browsers include support for:
- Canvas
- BLOB (Binary Large OBject, or large binary data as a single entity)
- base-64 encoding and decoding
These technologies perform the necessary conversion from SVG to the required format (the rendered charts in the .jpg, .png, or .pdf formats, or the chart data in the .xls format). Using the HTML5 API helps to overcome the earlier browser functionality limitations that hampered the implementation of this feature.
FusionCharts supports exporting chart data as XLS starting v3.11.0. Select Download as XLS from the menu at the top-right corner of the chart.