Demos

Beginner's Guide

Charts / Gauges / Maps Guide

Customizing Charts

API

Integrating With Your Stack

Help

Loading

Drag-node charts let you update data in real-time. To access the updated JSON data at the client-side using JavaScript, you can parse this data and update your data sources through AJAX, etc.

In this section, you will be shown how you can read the updated data using JavaScript functions present on the same page.

Once the chart is rendered, to access the chart’s updated data as JSON, simply call the getJSONData() function on the chart.

The code snippet to do this is given below:

//Get a reference to our chart
var ourChart = FusionCharts("NodeChart");

//Get the data from chart
var jsonRtn = ourChart.getJSONData();

//Show it to user in alert box.
alert(JSON.stringify(jsonRtn));

The function getJSONData() returns the latest or changed data. This function is also used to retrieve the original data from the chart. To get the original data from the chart you need false as a parameter to the function. For example, var jsonRtn = ourChart.getJSONData(false);

To understand this, the sample drag-node chart we will use looks like this:

FusionCharts will load here..
{ "chart": { "caption": "US Subway Map", "xaxisminvalue": "0", "xaxismaxvalue": "100", "yaxisminvalue": "0", "yaxismaxvalue": "100", "is3d": "0", "showformbtn": "1", "formaction": "resources/php/chart-guide-drag-node-chart-getting-data-using-javascript-update.php", "formtarget": "_blank", "formmethod": "POST", "formbtntitle": "Save", "viewmode": "0", "showplotborder": "1", "plotborderthickness": "4", "theme": "fint", "showcanvasborder": "1", "canvasborderalpha": "20", "animation": "0" }, "dataset": [ { "data": [ { "id": "01", "label": "Santa Monica", "color": "#ffffff", "x": "16", "y": "54", "radius": "30", "shape": "circle" }, { "id": "02", "label": "Los Angeles", "color": "#ffffff", "x": "27", "y": "54", "radius": "30", "shape": "circle" }, { "id": "03", "label": "Ontario", "color": "#ffffff", "x": "48", "y": "54", "radius": "30", "shape": "circle" }, { "id": "04", "label": "Phoenix", "color": "#ffffff", "x": "85", "y": "54", "radius": "30", "shape": "circle" }, { "id": "05", "label": "Flagstaff", "color": "#ffffff", "x": "85", "y": "80", "radius": "30", "shape": "circle" }, { "id": "06", "label": "Barstow", "color": "#ffffff", "x": "62", "y": "80", "radius": "30", "shape": "circle" }, { "id": "07", "label": "San Diego", "color": "#ffffff", "x": "35", "y": "30", "radius": "30", "shape": "circle" }, { "id": "08", "label": "San Ysidro", "color": "#ffffff", "x": "40", "y": "12", "radius": "30", "shape": "circle" }, { "id": "09", "label": "Las Vegas", "color": "#ffffff", "x": "68", "y": "93", "radius": "30", "shape": "circle" }, { "id": "10", "label": "", "color": "#ffffff", "x": "12", "y": "98", "radius": "0", "shape": "circle" }, { "id": "11", "label": "", "color": "#ffffff", "x": "100", "y": "80", "radius": "0", "shape": "circle" }, { "id": "12", "label": "", "color": "#ffffff", "x": "99", "y": "40", "radius": "0", "shape": "circle" }, { "id": "13", "label": "Yuma", "color": "#ffffff", "x": "70", "y": "30", "radius": "30", "shape": "circle" }, { "id": "14", "label": "", "color": "#ffffff", "x": "100", "y": "30", "radius": "0", "shape": "circle" } ] } ], "connectors": [ { "color": "#ffffff", "stdthickness": "10", "connector": [ { "strength": "2", "from": "01", "to": "02", "color": "#fec110", "arrowatstart": "0", "arrowatend": "0" }, { "strength": "2", "from": "02", "to": "03", "color": "#fec110", "arrowatstart": "0", "arrowatend": "0" }, { "strength": "2", "from": "03", "to": "04", "color": "#fec110", "arrowatstart": "0", "arrowatend": "0" }, { "strength": "2", "from": "04", "to": "12", "color": "#fec110", "arrowatstart": "0", "arrowatend": "0" }, { "strength": "2", "from": "04", "to": "05", "color": "#a6aaad", "arrowatstart": "0", "arrowatend": "0" }, { "strength": "2", "from": "09", "to": "06", "color": "#0178bc", "arrowatstart": "0", "arrowatend": "0" }, { "strength": "2", "from": "06", "to": "03", "color": "#0178bc", "arrowatstart": "0", "arrowatend": "0" }, { "strength": "2", "from": "03", "to": "07", "color": "#0178bc", "arrowatstart": "0", "arrowatend": "0" }, { "strength": "2", "from": "05", "to": "06", "color": "#f1277d", "arrowatstart": "0", "arrowatend": "0" }, { "strength": "2", "from": "06", "to": "11", "color": "#f1277d", "arrowatstart": "0", "arrowatend": "0" }, { "strength": "2", "from": "02", "to": "07", "color": "#c1c733", "arrowatstart": "0", "arrowatend": "0" }, { "strength": "2", "from": "07", "to": "08", "color": "#c1c733", "arrowatstart": "0", "arrowatend": "0" }, { "strength": "2", "from": "02", "to": "10", "color": "#c1c733", "arrowatstart": "0", "arrowatend": "0" }, { "strength": "2", "from": "07", "to": "13", "color": "#6d6e70", "arrowatstart": "0", "arrowatend": "0" }, { "strength": "2", "from": "13", "to": "14", "color": "#6d6e70", "arrowatstart": "0", "arrowatend": "0" } ] } ] }
{
    "chart": {
        "caption": "US Subway Map",
        "xaxisminvalue": "0",
        "xaxismaxvalue": "100",
        "yaxisminvalue": "0",
        "yaxismaxvalue": "100",
        "is3d": "0",
        "showformbtn": "1",
        "formaction": "resources/php/chart-guide-drag-node-chart-getting-data-using-javascript-update.php",
        "formtarget": "_blank",
        "formmethod": "POST",
        "formbtntitle": "Save",
        "viewmode": "0",
        "showplotborder": "1",
        "plotborderthickness": "4",
        "theme": "fint",
        "showcanvasborder": "1",
        "canvasborderalpha": "20",
        "animation": "0"
    },
    "dataset": [
        {
            "data": [
                {
                    "id": "01",
                    "label": "Santa Monica",
                    "color": "#ffffff",
                    "x": "16",
                    "y": "54",
                    "radius": "30",
                    "shape": "circle"
                },
                {
                    "id": "02",
                    "label": "Los Angeles",
                    "color": "#ffffff",
                    "x": "27",
                    "y": "54",
                    "radius": "30",
                    "shape": "circle"
                },
                {
                    "id": "03",
                    "label": "Ontario",
                    "color": "#ffffff",
                    "x": "48",
                    "y": "54",
                    "radius": "30",
                    "shape": "circle"
                },
                {
                    "id": "04",
                    "label": "Phoenix",
                    "color": "#ffffff",
                    "x": "85",
                    "y": "54",
                    "radius": "30",
                    "shape": "circle"
                },
                {
                    "id": "05",
                    "label": "Flagstaff",
                    "color": "#ffffff",
                    "x": "85",
                    "y": "80",
                    "radius": "30",
                    "shape": "circle"
                },
                {
                    "id": "06",
                    "label": "Barstow",
                    "color": "#ffffff",
                    "x": "62",
                    "y": "80",
                    "radius": "30",
                    "shape": "circle"
                },
                {
                    "id": "07",
                    "label": "San Diego",
                    "color": "#ffffff",
                    "x": "35",
                    "y": "30",
                    "radius": "30",
                    "shape": "circle"
                },
                {
                    "id": "08",
                    "label": "San Ysidro",
                    "color": "#ffffff",
                    "x": "40",
                    "y": "12",
                    "radius": "30",
                    "shape": "circle"
                },
                {
                    "id": "09",
                    "label": "Las Vegas",
                    "color": "#ffffff",
                    "x": "68",
                    "y": "93",
                    "radius": "30",
                    "shape": "circle"
                },
                {
                    "id": "10",
                    "label": "",
                    "color": "#ffffff",
                    "x": "12",
                    "y": "98",
                    "radius": "0",
                    "shape": "circle"
                },
                {
                    "id": "11",
                    "label": "",
                    "color": "#ffffff",
                    "x": "100",
                    "y": "80",
                    "radius": "0",
                    "shape": "circle"
                },
                {
                    "id": "12",
                    "label": "",
                    "color": "#ffffff",
                    "x": "99",
                    "y": "40",
                    "radius": "0",
                    "shape": "circle"
                },
                {
                    "id": "13",
                    "label": "Yuma",
                    "color": "#ffffff",
                    "x": "70",
                    "y": "30",
                    "radius": "30",
                    "shape": "circle"
                },
                {
                    "id": "14",
                    "label": "",
                    "color": "#ffffff",
                    "x": "100",
                    "y": "30",
                    "radius": "0",
                    "shape": "circle"
                }
            ]
        }
    ],
    "connectors": [
        {
            "color": "#ffffff",
            "stdthickness": "10",
            "connector": [
                {
                    "strength": "2",
                    "from": "01",
                    "to": "02",
                    "color": "#fec110",
                    "arrowatstart": "0",
                    "arrowatend": "0"
                },
                {
                    "strength": "2",
                    "from": "02",
                    "to": "03",
                    "color": "#fec110",
                    "arrowatstart": "0",
                    "arrowatend": "0"
                },
                {
                    "strength": "2",
                    "from": "03",
                    "to": "04",
                    "color": "#fec110",
                    "arrowatstart": "0",
                    "arrowatend": "0"
                },
                {
                    "strength": "2",
                    "from": "04",
                    "to": "12",
                    "color": "#fec110",
                    "arrowatstart": "0",
                    "arrowatend": "0"
                },
                {
                    "strength": "2",
                    "from": "04",
                    "to": "05",
                    "color": "#a6aaad",
                    "arrowatstart": "0",
                    "arrowatend": "0"
                },
                {
                    "strength": "2",
                    "from": "09",
                    "to": "06",
                    "color": "#0178bc",
                    "arrowatstart": "0",
                    "arrowatend": "0"
                },
                {
                    "strength": "2",
                    "from": "06",
                    "to": "03",
                    "color": "#0178bc",
                    "arrowatstart": "0",
                    "arrowatend": "0"
                },
                {
                    "strength": "2",
                    "from": "03",
                    "to": "07",
                    "color": "#0178bc",
                    "arrowatstart": "0",
                    "arrowatend": "0"
                },
                {
                    "strength": "2",
                    "from": "05",
                    "to": "06",
                    "color": "#f1277d",
                    "arrowatstart": "0",
                    "arrowatend": "0"
                },
                {
                    "strength": "2",
                    "from": "06",
                    "to": "11",
                    "color": "#f1277d",
                    "arrowatstart": "0",
                    "arrowatend": "0"
                },
                {
                    "strength": "2",
                    "from": "02",
                    "to": "07",
                    "color": "#c1c733",
                    "arrowatstart": "0",
                    "arrowatend": "0"
                },
                {
                    "strength": "2",
                    "from": "07",
                    "to": "08",
                    "color": "#c1c733",
                    "arrowatstart": "0",
                    "arrowatend": "0"
                },
                {
                    "strength": "2",
                    "from": "02",
                    "to": "10",
                    "color": "#c1c733",
                    "arrowatstart": "0",
                    "arrowatend": "0"
                },
                {
                    "strength": "2",
                    "from": "07",
                    "to": "13",
                    "color": "#6d6e70",
                    "arrowatstart": "0",
                    "arrowatend": "0"
                },
                {
                    "strength": "2",
                    "from": "13",
                    "to": "14",
                    "color": "#6d6e70",
                    "arrowatstart": "0",
                    "arrowatend": "0"
                }
            ]
        }
    ]
}
<html>
<head>
<title>My first chart using FusionCharts Suite XT</title>
<script type="text/javascript" src="http://static.fusioncharts.com/code/latest/fusioncharts.js"></script>
<script type="text/javascript" src="http://static.fusioncharts.com/code/latest/themes/fusioncharts.theme.fint.js?cacheBust=56"></script>
<script type="text/javascript">
  FusionCharts.ready(function(){
    var fusioncharts = new FusionCharts({
    type: 'dragnode',
    id: 'subwaymap',
    renderAt: 'chart-container',
    width: '800',
    height: '600',
    dataFormat: 'json',
    dataSource: {
        "chart": {
            "caption": "US Subway Map",
            "xaxisminvalue": "0",
            "xaxismaxvalue": "100",
            "yaxisminvalue": "0",
            "yaxismaxvalue": "100",
            "is3d": "0",
            "showformbtn": "1",
            "formaction": "resources/php/chart-guide-drag-node-chart-getting-data-using-javascript-update.php",
            "formtarget": "_blank",
            "formmethod": "POST",
            "formbtntitle": "Save",
            "viewmode": "0",
            "showplotborder": "1",
            "plotborderthickness": "4",
            "theme": "fint",
            "showcanvasborder": "1",
            "canvasborderalpha": "20",
            "animation": "0"
        },
        "dataset": [{
            "data": [{
                "id": "01",
                "label": "Santa Monica",
                "color": "#ffffff",
                "x": "16",
                "y": "54",
                "radius": "30",
                "shape": "circle"
            }, {
                "id": "02",
                "label": "Los Angeles",
                "color": "#ffffff",
                "x": "27",
                "y": "54",
                "radius": "30",
                "shape": "circle"
            }, {
                "id": "03",
                "label": "Ontario",
                "color": "#ffffff",
                "x": "48",
                "y": "54",
                "radius": "30",
                "shape": "circle"
            }, {
                "id": "04",
                "label": "Phoenix",
                "color": "#ffffff",
                "x": "85",
                "y": "54",
                "radius": "30",
                "shape": "circle"
            }, {
                "id": "05",
                "label": "Flagstaff",
                "color": "#ffffff",
                "x": "85",
                "y": "80",
                "radius": "30",
                "shape": "circle"
            }, {
                "id": "06",
                "label": "Barstow",
                "color": "#ffffff",
                "x": "62",
                "y": "80",
                "radius": "30",
                "shape": "circle"
            }, {
                "id": "07",
                "label": "San Diego",
                "color": "#ffffff",
                "x": "35",
                "y": "30",
                "radius": "30",
                "shape": "circle"
            }, {
                "id": "08",
                "label": "San Ysidro",
                "color": "#ffffff",
                "x": "40",
                "y": "12",
                "radius": "30",
                "shape": "circle"
            }, {
                "id": "09",
                "label": "Las Vegas",
                "color": "#ffffff",
                "x": "68",
                "y": "93",
                "radius": "30",
                "shape": "circle"
            }, {
                "id": "10",
                "label": "",
                "color": "#ffffff",
                "x": "12",
                "y": "98",
                "radius": "0",
                "shape": "circle"
            }, {
                "id": "11",
                "label": "",
                "color": "#ffffff",
                "x": "100",
                "y": "80",
                "radius": "0",
                "shape": "circle"
            }, {
                "id": "12",
                "label": "",
                "color": "#ffffff",
                "x": "99",
                "y": "40",
                "radius": "0",
                "shape": "circle"
            }, {
                "id": "13",
                "label": "Yuma",
                "color": "#ffffff",
                "x": "70",
                "y": "30",
                "radius": "30",
                "shape": "circle"
            }, {
                "id": "14",
                "label": "",
                "color": "#ffffff",
                "x": "100",
                "y": "30",
                "radius": "0",
                "shape": "circle"
            }]
        }],
        "connectors": [{
            "color": "#ffffff",
            "stdthickness": "10",
            "connector": [{
                "strength": "2",
                "from": "01",
                "to": "02",
                "color": "#fec110",
                "arrowatstart": "0",
                "arrowatend": "0"
            }, {
                "strength": "2",
                "from": "02",
                "to": "03",
                "color": "#fec110",
                "arrowatstart": "0",
                "arrowatend": "0"
            }, {
                "strength": "2",
                "from": "03",
                "to": "04",
                "color": "#fec110",
                "arrowatstart": "0",
                "arrowatend": "0"
            }, {
                "strength": "2",
                "from": "04",
                "to": "12",
                "color": "#fec110",
                "arrowatstart": "0",
                "arrowatend": "0"
            }, {
                "strength": "2",
                "from": "04",
                "to": "05",
                "color": "#a6aaad",
                "arrowatstart": "0",
                "arrowatend": "0"
            }, {
                "strength": "2",
                "from": "09",
                "to": "06",
                "color": "#0178bc",
                "arrowatstart": "0",
                "arrowatend": "0"
            }, {
                "strength": "2",
                "from": "06",
                "to": "03",
                "color": "#0178bc",
                "arrowatstart": "0",
                "arrowatend": "0"
            }, {
                "strength": "2",
                "from": "03",
                "to": "07",
                "color": "#0178bc",
                "arrowatstart": "0",
                "arrowatend": "0"
            }, {
                "strength": "2",
                "from": "05",
                "to": "06",
                "color": "#f1277d",
                "arrowatstart": "0",
                "arrowatend": "0"
            }, {
                "strength": "2",
                "from": "06",
                "to": "11",
                "color": "#f1277d",
                "arrowatstart": "0",
                "arrowatend": "0"
            }, {
                "strength": "2",
                "from": "02",
                "to": "07",
                "color": "#c1c733",
                "arrowatstart": "0",
                "arrowatend": "0"
            }, {
                "strength": "2",
                "from": "07",
                "to": "08",
                "color": "#c1c733",
                "arrowatstart": "0",
                "arrowatend": "0"
            }, {
                "strength": "2",
                "from": "02",
                "to": "10",
                "color": "#c1c733",
                "arrowatstart": "0",
                "arrowatend": "0"
            }, {
                "strength": "2",
                "from": "07",
                "to": "13",
                "color": "#6d6e70",
                "arrowatstart": "0",
                "arrowatend": "0"
            }, {
                "strength": "2",
                "from": "13",
                "to": "14",
                "color": "#6d6e70",
                "arrowatstart": "0",
                "arrowatend": "0"
            }]
        }]
    },
    events: {
        'beforeRender': function(event, args) {
            // creating div for controllers
            var controllers = document.createElement('div'),
                chartRef = event.sender,
                restoreBtn,
                httpRequest,
                //Function to restore data
                restoreData = function() {
                    if (window.XMLHttpRequest) { // Mozilla, Safari, ...
                        httpRequest = new XMLHttpRequest();
                    } else if (window.ActiveXObject) { // IE 8 and older
                        httpRequest = new ActiveXObject("Microsoft.XMLHTTP");
                    }
                    httpRequest.onreadystatechange = function() {
                        if (httpRequest.readyState === 4) {
                            chartRef.setXMLUrl('../../resources/xml/chart-guide-drag-node-chart-getting-data-using-javascript.xml');
                            alert("Data Restored");
                        } else if (httpRequest.readyState >= 400) {
                            alert("Data Restored Failed");
                        }
                    };

                    httpRequest.open('GET', '../../resources/php/chart-guide-drag-node-chart-getting-data-using-javascript-restore.php', true);
                    httpRequest.send(null);
                };

            controllers.setAttribute('id', 'btnCont');

            // Create Button inside div
            controllers.innerHTML = '<input id="restoreXML" type="submit" name="Submit" value="Restore Original Data">';

            args.container.parentNode.insertBefore(controllers, args.container.nextSibling);

            // setting css styles for controllers div
            controllers.style.cssText = "width: 800px; text-align:center;";
            restoreBtn = document.getElementById('restoreXML');

            //Set event listener for check boxes
            restoreBtn.addEventListener && restoreBtn.addEventListener("click", restoreData);
        },
        "datasubmitted": function(e, a) {
            alert("Successfully Saved");
        }
    }
}
);
    fusioncharts.render();
});
</script>
</head>
<body>
  <div id="chart-container">FusionCharts XT will load here!</div>
</body>
</html>

Now, we will make the following updates to this drag-node chart:

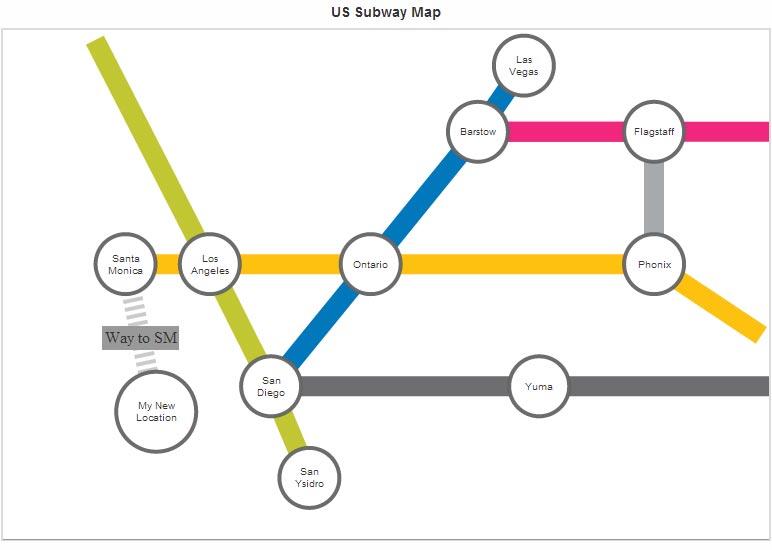
  • Add a node, My New Location, using the Add a Node menu item.

  • Add a connector, Way to SM, between “Santa Monica” and “My New Location”, using the Add a Connector menu item.

The drag-node chart rendered after making these updates looks like this:

Updated Dragnode Chart

Now if you wish to get the current data using the code var jsonRtn = ourChart.getJSONData(); alert(JSON.stringify(jsonRtn));, the updated data will be shown. The modified part of the updated data is shown below:

{
    "chart": {
            ...
    },
    "dataset": [{
        "data": [
            ...
            {
                "x": "20",
                "y": "25",
                "id": "myLoc",
                "datasetId": "0",
                "name": "My New Location",
                "tooltext": "My Location",
                "color": "#FFFFFF",
                "alpha": "100",
                "labelalign": "middle",
                "allowdrag": 1,
                "shape": "circle",
                "width": "",
                "height": "",
                "radius": "40",
                "numsides": "",
                "imagenode": 0,
                "imagewidth": "",
                "imageheight": "",
                "imagealign": "",
                "imageurl": "",
                "link": "http://www.fusioncharts.com"
            }
        ]
    }],
    "connectors": [{
        ...
        {
            ...
        },
        ...
        {
            "from": "myLoc",
            "to": "01",
            "id": "",
            "label": "Way to SM",
            "color": "#999999",
            "alpha": "50",
            "link": "",
            "tooltext": "",
            "strength": "2",
            "arrowatstart": "0",
            "arrowatend": "0",
            "dashed": "1",
            "dashlen": "4",
            "dashgap": "4"
        }
    ]},
    "labels": {
        "label": []
    }
}
Top