Loading
Configuring Angles & Origins
FusionCharts Suite XT allows you to draw the angular gauge from virtually any start angle to any end angle and in both directions.
In this section, you will be shown you can:
Using the chart Object Attributes to Create Gauges
The following attributes of the chart object are the main control parameters that help to create charts of various angles and from various starting points:
| Attribute Name | Description |
|---|---|
|
It is used to specify the angle at which the gauge will start drawing.This attribute takes values between - 360 and 360 with 180 as the default value. |
|
It is used to specify the angle at which the gauge will finish drawing. This attribute takes values between -360 and 360 with 0 as the default value. |
|
It is used to manually specify the x - coordinate at which the center of the gauge will be placed.This attribute is useful when you are designing small angle gauges or when you are using custom objects to draw certain objects and need to set the exact center position. |
|
It is used to manually specify the y-coordinate at which the center of the gauge will be placed. This attribute is useful when you are designing small angle gauges or when you are using custom objects to draw certain objects and need to set the exact center position. |
|
It is used to specify the outer radius,in pixels,for the color range scale. |
|
It is used to specify the inner radius, in pixels, for the color range scale. This attribute can take two types of values: one as exact pixels and the second as a percentage of the outer radius (e.g. 75%). |
Configuring Angular Gauge Angles
The angular gauge comprehends angles as shown in the images below:
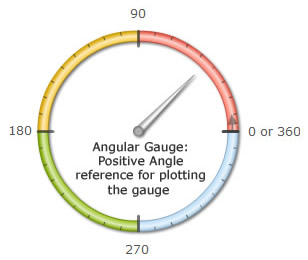
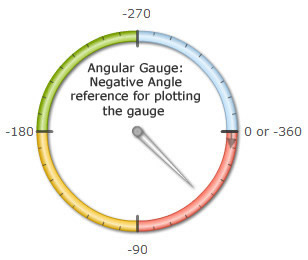
Each point in the circle can be represented by two angles - a positive angle and a negative angle.This enables you to plot bi-directional angular gauges.
An angular gauge flipped horizontally looks like this:
{
    "chart": {
        "caption": "Customer Satisfaction Score",
        "subcaption": "Last week",
        "gaugeStartAngle": "0",
        "gaugeEndAngle": "90",
        "lowerLimit": "0",
        "upperLimit": "100",
        "gaugeFillMix": "{dark-40},{light-40},{dark-20}",
        "theme": "fint"
    },
    "colorRange": {
        "color": [
            {
                "minValue": "0",
                "maxValue": "50",
                "code": "#e44a00"
            },
            {
                "minValue": "50",
                "maxValue": "75",
                "code": "#f8bd19"
            },
            {
                "minValue": "75",
                "maxValue": "100",
                "code": "#6baa01"
            }
        ]
    },
    "dials": {
        "dial": [
            {
                "value": "67",
                "radius": "140",
                "rearExtension": "15"
            }
        ]
    }
}
<html>
<head>
<title>My first chart using FusionCharts Suite XT</title>
<script type="text/javascript" src="http://static.fusioncharts.com/code/latest/fusioncharts.js"></script>
<script type="text/javascript" src="http://static.fusioncharts.com/code/latest/themes/fusioncharts.theme.fint.js?cacheBust=56"></script>
<script type="text/javascript">
FusionCharts.ready(function(){
var fusioncharts = new FusionCharts({
type: 'angulargauge',
renderAt: 'chart-container',
width: '400',
height: '300',
dataFormat: 'json',
dataSource: {
"chart": {
"caption": "Customer Satisfaction Score",
"subcaption": "Last week",
"gaugeStartAngle": "0",
"gaugeEndAngle": "90",
"lowerLimit": "0",
"upperLimit": "100",
"gaugeFillMix": "{dark-40},{light-40},{dark-20}",
"theme": "fint"
},
"colorRange": {
"color": [{
"minValue": "0",
"maxValue": "50",
"code": "#e44a00"
}, {
"minValue": "50",
"maxValue": "75",
"code": "#f8bd19"
}, {
"minValue": "75",
"maxValue": "100",
"code": "#6baa01"
}]
},
"dials": {
"dial": [{
"value": "67",
"radius": "140",
"rearExtension": "15"
}]
}
}
}
);
fusioncharts.render();
});
</script>
</head>
<body>
<div id="chart-container">FusionCharts XT will load here!</div>
</body>
</html>To flip the gauge, all you need to do is swap the default values of the gaugeStartAngle and the gaugeEndAngle attributes.
When specifying the start and end angles for gauges, you should always make sure that the difference between start and end angle should not be more than 360 degrees, else the gauge will not behave as intended.
Automatic Positioning of Gauge Origins
Based on the start and end angle measures of the gauge, the x and y center points (origins) of the gauge are automatically positioned.
Shown below are some examples that will help you understand how the origin points shift based on the angle measures.
Example:
An angular gauge with the start angle and end angle measuring 0° and 90° respectively looks like this:
{
    "chart": {
        "caption": "Customer Satisfaction Score",
        "subcaption": "Last week",
        "gaugeStartAngle": "0",
        "gaugeEndAngle": "90",
        "lowerLimit": "0",
        "upperLimit": "100",
        "gaugeFillMix": "{dark-40},{light-40},{dark-20}",
        "theme": "fint"
    },
    "colorRange": {
        "color": [
            {
                "minValue": "0",
                "maxValue": "50",
                "code": "#e44a00"
            },
            {
                "minValue": "50",
                "maxValue": "75",
                "code": "#f8bd19"
            },
            {
                "minValue": "75",
                "maxValue": "100",
                "code": "#6baa01"
            }
        ]
    },
    "dials": {
        "dial": [
            {
                "value": "67",
                "radius": "140",
                "rearExtension": "15"
            }
        ]
    }
}
<html>
<head>
<title>My first chart using FusionCharts Suite XT</title>
<script type="text/javascript" src="http://static.fusioncharts.com/code/latest/fusioncharts.js"></script>
<script type="text/javascript" src="http://static.fusioncharts.com/code/latest/themes/fusioncharts.theme.fint.js?cacheBust=56"></script>
<script type="text/javascript">
FusionCharts.ready(function(){
var fusioncharts = new FusionCharts({
type: 'angulargauge',
renderAt: 'chart-container',
width: '400',
height: '300',
dataFormat: 'json',
dataSource: {
"chart": {
"caption": "Customer Satisfaction Score",
"subcaption": "Last week",
"gaugeStartAngle": "0",
"gaugeEndAngle": "90",
"lowerLimit": "0",
"upperLimit": "100",
"gaugeFillMix": "{dark-40},{light-40},{dark-20}",
"theme": "fint"
},
"colorRange": {
"color": [{
"minValue": "0",
"maxValue": "50",
"code": "#e44a00"
}, {
"minValue": "50",
"maxValue": "75",
"code": "#f8bd19"
}, {
"minValue": "75",
"maxValue": "100",
"code": "#6baa01"
}]
},
"dials": {
"dial": [{
"value": "67",
"radius": "140",
"rearExtension": "15"
}]
}
}
}
);
fusioncharts.render();
});
</script>
</head>
<body>
<div id="chart-container">FusionCharts XT will load here!</div>
</body>
</html>You can change the values of the startAngle and the endAngle attributes and see how the position of the origin
for each gauge changes depending on the combination of the start and end angle measures.
Important note: Along with positioning the origins, a JavaScript Angular gauge also scales itself to best - fit into the available space.
Manually Setting Gauge Origins
You can manually configure the gauge origins if the automatic adjustment of the origins based on the start and end angle measures does not meet your requirement. To manually set gauge origins, you will need to explicitly set your required values for the gaugeOriginX and gaugeOriginY attributes.
An angular gauge rendered with manually-specified gauge origins looks like this:
{
    "chart": {
        "caption": "Customer Satisfaction Score",
        "subcaption": "Los Angeles Topanga",
        "plotToolText": "Current Score: $value",
        "gaugeFillMix": "{dark-40},{light-40},{dark-20}",
        "theme": "fint",
        "gaugeOriginY": "230",
        "showValue": "1"
    },
    "colorRange": {
        "color": [
            {
                "minValue": "0",
                "maxValue": "4.5",
                "code": "#e44a00"
            },
            {
                "minValue": "4.5",
                "maxValue": "7.5",
                "code": "#f8bd19"
            },
            {
                "minValue": "7.5",
                "maxValue": "10",
                "code": "#6baa01"
            }
        ]
    },
    "dials": {
        "dial": [
            {
                "value": "8.9"
            }
        ]
    },
    "trendPoints": {
        "point": [
            {
                "startValue": "6.8",
                "color": "#0075c2",
                "dashed": "1"
            },
            {
                "startValue": "9.5",
                "color": "#0075c2",
                "dashed": "1"
            },
            {
                "startValue": "6.8",
                "endValue": "9.5",
                "color": "#0075c2",
                "radius": "185",
                "innerRadius": "80"
            }
        ]
    },
    "annotations": {
        "origw": "450",
        "origh": "300",
        "autoscale": "1",
        "showBelow": "0",
        "groups": [
            {
                "id": "arcs",
                "items": [
                    {
                        "id": "national-cs-bg",
                        "type": "rectangle",
                        "x": "$chartCenterX+2",
                        "y": "$chartEndY - 45",
                        "tox": "$chartCenterX + 130",
                        "toy": "$chartEndY - 25",
                        "fillcolor": "#f8bd19"
                    },
                    {
                        "id": "national-cs-text",
                        "type": "Text",
                        "color": "#ffffff",
                        "label": "National Average : 7.2",
                        "fontSize": "12",
                        "align": "left",
                        "x": "$chartCenterX + 7",
                        "y": "$chartEndY - 35"
                    },
                    {
                        "id": "state-cs-bg",
                        "type": "rectangle",
                        "x": "$chartCenterX-2",
                        "y": "$chartEndY - 45",
                        "tox": "$chartCenterX - 103",
                        "toy": "$chartEndY - 25",
                        "fillcolor": "#6baa01"
                    },
                    {
                        "id": "state-cs-text",
                        "type": "Text",
                        "color": "#ffffff",
                        "label": "State Average : 8",
                        "fontSize": "12",
                        "align": "right",
                        "x": "$chartCenterX - 7",
                        "y": "$chartEndY - 35"
                    },
                    {
                        "id": "store-cs-bg",
                        "type": "rectangle",
                        "x": "$chartCenterX-130",
                        "y": "$chartEndY - 22",
                        "tox": "$chartCenterX + 150",
                        "toy": "$chartEndY - 2",
                        "fillcolor": "#0075c2"
                    },
                    {
                        "id": "state-cs-text",
                        "type": "Text",
                        "color": "#ffffff",
                        "label": "Store's Customer Satisfaction Range: 6.8 to 9.5",
                        "fontSize": "12",
                        "align": "center",
                        "x": "$chartCenterX + 10",
                        "y": "$chartEndY - 12"
                    }
                ]
            }
        ]
    }
}
<html>
<head>
<title>My first chart using FusionCharts Suite XT</title>
<script type="text/javascript" src="http://static.fusioncharts.com/code/latest/fusioncharts.js"></script>
<script type="text/javascript" src="http://static.fusioncharts.com/code/latest/themes/fusioncharts.theme.fint.js?cacheBust=56"></script>
<script type="text/javascript">
FusionCharts.ready(function(){
var fusioncharts = new FusionCharts({
type: 'angulargauge',
renderAt: 'chart-container',
width: '450',
height: '300',
dataFormat: 'json',
dataSource: {
"chart": {
"caption": "Customer Satisfaction Score",
"subcaption": "Los Angeles Topanga",
"plotToolText": "Current Score: $value",
"gaugeFillMix": "{dark-40},{light-40},{dark-20}",
"theme": "fint",
"gaugeOriginY": "230",
"showValue": "1"
},
"colorRange": {
"color": [{
"minValue": "0",
"maxValue": "4.5",
"code": "#e44a00"
}, {
"minValue": "4.5",
"maxValue": "7.5",
"code": "#f8bd19"
}, {
"minValue": "7.5",
"maxValue": "10",
"code": "#6baa01"
}]
},
"dials": {
"dial": [{
"value": "8.9"
}]
},
"trendPoints": {
"point": [{
"startValue": "6.8",
"color": "#0075c2",
"dashed": "1"
}, {
"startValue": "9.5",
"color": "#0075c2",
"dashed": "1"
}, {
"startValue": "6.8",
"endValue": "9.5",
"color": "#0075c2",
"radius": "185",
"innerRadius": "80"
}]
},
"annotations": {
"origw": "450",
"origh": "300",
"autoscale": "1",
"showBelow": "0",
"groups": [{
"id": "arcs",
"items": [{
"id": "national-cs-bg",
"type": "rectangle",
"x": "$chartCenterX+2",
"y": "$chartEndY - 45",
"tox": "$chartCenterX + 130",
"toy": "$chartEndY - 25",
"fillcolor": "#f8bd19"
}, {
"id": "national-cs-text",
"type": "Text",
"color": "#ffffff",
"label": "National Average : 7.2",
"fontSize": "12",
"align": "left",
"x": "$chartCenterX + 7",
"y": "$chartEndY - 35"
}, {
"id": "state-cs-bg",
"type": "rectangle",
"x": "$chartCenterX-2",
"y": "$chartEndY - 45",
"tox": "$chartCenterX - 103",
"toy": "$chartEndY - 25",
"fillcolor": "#6baa01"
}, {
"id": "state-cs-text",
"type": "Text",
"color": "#ffffff",
"label": "State Average : 8",
"fontSize": "12",
"align": "right",
"x": "$chartCenterX - 7",
"y": "$chartEndY - 35"
}, {
"id": "store-cs-bg",
"type": "rectangle",
"x": "$chartCenterX-130",
"y": "$chartEndY - 22",
"tox": "$chartCenterX + 150",
"toy": "$chartEndY - 2",
"fillcolor": "#0075c2"
}, {
"id": "state-cs-text",
"type": "Text",
"color": "#ffffff",
"label": "Store's Customer Satisfaction Range: 6.8 to 9.5",
"fontSize": "12",
"align": "center",
"x": "$chartCenterX + 10",
"y": "$chartEndY - 12"
}]
}]
}
}
}
);
fusioncharts.render();
});
</script>
</head>
<body>
<div id="chart-container">FusionCharts XT will load here!</div>
</body>
</html>In the above example we have only modified the gaugeOriginY attribute to shift the origin upward, you can do similar adjustments with gaugeOriginX also.
If you were to dynamically resize the gauge now with proper configuration, as explained in the [Dynamically Resizing Gauges |
FusionCharts](/archive/3.12.0/gauge-and-widgets-guide/angular-gauge/dynamically-resizing-gauges.html) section, FusionCharts Suite XT will automatically resize the origin positions and radius specified. |