Loading
Legend
A legend is a chart element that is used to display the series name of each dataset in multi-series/combination charts. Legends are not applicable to single series charts. Legends are used to correlate a data plot to its series name using its color.
In the following image, the legend rendered below the x-axis helps to identify the data plots corresponding to a series name.
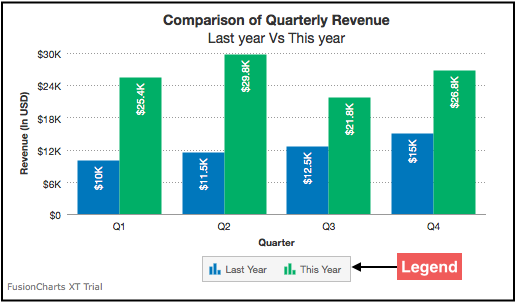
Each series is represented by it’s own icon in the legend.
This article talks about:
-
Showing/hiding the corresponding data series when a legend icon is clicked
-
Highlighting the corresponding data series when a legend text is hovered over
Showing/hiding the corresponding data series when a legend item is clicked
FusionCharts Suite XT supports legend interactivity. One of the features that comes under legend interactivity is being able to show/hide the data plots belonging to a data series by clicking the corresponding legend icon.
In the live chart shown below, when the legend icon for Last Year is clicked, all data plots in blue, showing the quarterly revenue for the last year, are hidden.
{
    "chart": {
        "caption": "Comparison of Quarterly Revenue",
        "subCaption": "Last year Vs This year",
        "xAxisname": "Quarter",
        "yAxisName": "Revenue (In USD)",
        "numberPrefix": "$",
        "theme": "fint"
    },
    "categories": [
        {
            "category": [
                {
                    "label": "Q1"
                },
                {
                    "label": "Q2"
                },
                {
                    "label": "Q3"
                },
                {
                    "label": "Q4"
                }
            ]
        }
    ],
    "dataset": [
        {
            "seriesname": "Last Year",
            "data": [
                {
                    "value": "10000"
                },
                {
                    "value": "11500"
                },
                {
                    "value": "12500"
                },
                {
                    "value": "15000"
                }
            ]
        },
        {
            "seriesname": "This Year",
            "data": [
                {
                    "value": "25400"
                },
                {
                    "value": "29800"
                },
                {
                    "value": "21800"
                },
                {
                    "value": "26800"
                }
            ]
        }
    ]
}
<html>
<head>
<title>My first chart using FusionCharts Suite XT</title>
<script type="text/javascript" src="http://static.fusioncharts.com/code/latest/fusioncharts.js"></script>
<script type="text/javascript" src="http://static.fusioncharts.com/code/latest/themes/fusioncharts.theme.fint.js?cacheBust=56"></script>
<script type="text/javascript">
FusionCharts.ready(function(){
var fusioncharts = new FusionCharts({
type: 'mscolumn2d',
renderAt: 'chart-container',
width: '500',
height: '300',
dataFormat: 'json',
dataSource: {
"chart": {
"caption": "Comparison of Quarterly Revenue",
"subCaption": "Last year Vs This year",
"xAxisname": "Quarter",
"yAxisName": "Revenue (In USD)",
"numberPrefix": "$",
"theme": "fint"
},
"categories": [{
"category": [{
"label": "Q1"
}, {
"label": "Q2"
}, {
"label": "Q3"
}, {
"label": "Q4"
}]
}],
"dataset": [{
"seriesname": "Last Year",
"data": [{
"value": "10000"
}, {
"value": "11500"
}, {
"value": "12500"
}, {
"value": "15000"
}]
}, {
"seriesname": "This Year",
"data": [{
"value": "25400"
}, {
"value": "29800"
}, {
"value": "21800"
}, {
"value": "26800"
}]
}]
}
}
);
fusioncharts.render();
});
</script>
</head>
<body>
<div id="chart-container">FusionCharts XT will load here!</div>
</body>
</html>Highlighting the corresponding data series when a legend text is hovered over
Starting FusionCharts Suite XT v3.10.0, FusionCharts has introduced a new legend interactivity feature. Now, every time the mouse pointer is hovered over a legend text, the corresponding data plots are highlighted by decreasing the opacity of the data plots belonging to the other data series.
For example, in the chart shown below, when the mouse pointer is hovered over the legend text This Year, the data plots in blue (corresponding to Last Year) fadeout and the data plots in green (corresponding to This Year) are highlighted.
{
    "chart": {
        "caption": "Comparison of Quarterly Revenue",
        "subCaption": "Last year Vs This year",
        "xAxisname": "Quarter",
        "yAxisName": "Revenue (In USD)",
        "numberPrefix": "$",
        "plotHighlightEffect": "fadeout",
        "theme": "fint"
    },
    "categories": [
        {
            "category": [
                {
                    "label": "Q1"
                },
                {
                    "label": "Q2"
                },
                {
                    "label": "Q3"
                },
                {
                    "label": "Q4"
                }
            ]
        }
    ],
    "dataset": [
        {
            "seriesname": "Last Year",
            "data": [
                {
                    "value": "10000"
                },
                {
                    "value": "11500"
                },
                {
                    "value": "12500"
                },
                {
                    "value": "15000"
                }
            ]
        },
        {
            "seriesname": "This Year",
            "data": [
                {
                    "value": "25400"
                },
                {
                    "value": "29800"
                },
                {
                    "value": "21800"
                },
                {
                    "value": "26800"
                }
            ]
        }
    ]
}
<html>
<head>
<title>My first chart using FusionCharts Suite XT</title>
<script type="text/javascript" src="http://static.fusioncharts.com/code/latest/fusioncharts.js"></script>
<script type="text/javascript" src="http://static.fusioncharts.com/code/latest/themes/fusioncharts.theme.fint.js?cacheBust=56"></script>
<script type="text/javascript">
FusionCharts.ready(function(){
var fusioncharts = new FusionCharts({
type: 'mscolumn2d',
renderAt: 'chart-container',
width: '500',
height: '300',
dataFormat: 'json',
dataSource: {
"chart": {
"caption": "Comparison of Quarterly Revenue",
"subCaption": "Last year Vs This year",
"xAxisname": "Quarter",
"yAxisName": "Revenue (In USD)",
"numberPrefix": "$",
"plotHighlightEffect": "fadeout",
"theme": "fint"
},
"categories": [{
"category": [{
"label": "Q1"
}, {
"label": "Q2"
}, {
"label": "Q3"
}, {
"label": "Q4"
}]
}],
"dataset": [{
"seriesname": "Last Year",
"data": [{
"value": "10000"
}, {
"value": "11500"
}, {
"value": "12500"
}, {
"value": "15000"
}]
}, {
"seriesname": "This Year",
"data": [{
"value": "25400"
}, {
"value": "29800"
}, {
"value": "21800"
}, {
"value": "26800"
}]
}]
}
}
);
fusioncharts.render();
});
</script>
</head>
<body>
<div id="chart-container">FusionCharts XT will load here!</div>
</body>
</html>Given below is a brief description of the attribute used to enable this feature:
| Attribute Name | Description |
|---|---|
|
Sets the highlight effect for data plots when the mouse pointer is hovered over a legend item. When the mouse pointer is hovered over a legend text and |
Customizing the highlight effect
Instead of just reducing the opacity of the data plots that don’t correspond to the hovered over legend text, you can customize a different effect.
Take a look at the sample chart shown below:
{
    "chart": {
        "caption": "Comparison of Quarterly Revenue",
        "subCaption": "Last year Vs This year",
        "xAxisname": "Quarter",
        "yAxisName": "Revenue (In USD)",
        "numberPrefix": "$",
        "plotHighlightEffect": "fadeout|color=#7f7f7f, alpha=60",
        "theme": "fint"
    },
    "categories": [
        {
            "category": [
                {
                    "label": "Q1"
                },
                {
                    "label": "Q2"
                },
                {
                    "label": "Q3"
                },
                {
                    "label": "Q4"
                }
            ]
        }
    ],
    "dataset": [
        {
            "seriesname": "Last Year",
            "data": [
                {
                    "value": "10000"
                },
                {
                    "value": "11500"
                },
                {
                    "value": "12500"
                },
                {
                    "value": "15000"
                }
            ]
        },
        {
            "seriesname": "This Year",
            "data": [
                {
                    "value": "25400"
                },
                {
                    "value": "29800"
                },
                {
                    "value": "21800"
                },
                {
                    "value": "26800"
                }
            ]
        }
    ]
}
<html>
<head>
<title>My first chart using FusionCharts Suite XT</title>
<script type="text/javascript" src="http://static.fusioncharts.com/code/latest/fusioncharts.js"></script>
<script type="text/javascript" src="http://static.fusioncharts.com/code/latest/themes/fusioncharts.theme.fint.js?cacheBust=56"></script>
<script type="text/javascript">
FusionCharts.ready(function(){
var fusioncharts = new FusionCharts({
type: 'mscolumn2d',
renderAt: 'chart-container',
width: '500',
height: '300',
dataFormat: 'json',
dataSource: {
"chart": {
"caption": "Comparison of Quarterly Revenue",
"subCaption": "Last year Vs This year",
"xAxisname": "Quarter",
"yAxisName": "Revenue (In USD)",
"numberPrefix": "$",
"plotHighlightEffect": "fadeout|color=#7f7f7f, alpha=60",
"theme": "fint"
},
"categories": [{
"category": [{
"label": "Q1"
}, {
"label": "Q2"
}, {
"label": "Q3"
}, {
"label": "Q4"
}]
}],
"dataset": [{
"seriesname": "Last Year",
"data": [{
"value": "10000"
}, {
"value": "11500"
}, {
"value": "12500"
}, {
"value": "15000"
}]
}, {
"seriesname": "This Year",
"data": [{
"value": "25400"
}, {
"value": "29800"
}, {
"value": "21800"
}, {
"value": "26800"
}]
}]
}
}
);
fusioncharts.render();
});
</script>
</head>
<body>
<div id="chart-container">FusionCharts XT will load here!</div>
</body>
</html>In this chart, when the mouse pointer is hovered over the legend text This Year, data plots belonging to the Last Year data series are grayed out.
The plotHighlightEffect attribute is defined in the following format in order to customize the highlight effect:
effectName always stays fadeout. confStr is a comma-separated list of customization properties for the effect.
Therefore, for the above chart, the attribute has been defined as shown below:
In addition, the following attributes can also be used to customize the highlight effect:
| Attribute Name | Description |
|---|---|
|
Hex code for the data plot fill color |
|
Transparency of the data plots |
|
Hex code for the plot border color |
|
Transparency of the plot border |
|
Hex code for the anchor background color |
|
Hex code for anchor border color |
|
Transparency of the anchor background |
|
Transparency of the anchor border |
|
Hex code for the data value background color |
|
Hex code for the data value border color |
|
Hex code for the data value font color |
Setting the legend position
A multi-series column 2D chart with the legend positioned in the right looks as below:
{
    "chart": {
        "caption": "Comparison of Quarterly Revenue",
        "subCaption": "Last year Vs This year",
        "xAxisname": "Quarter",
        "yAxisName": "Revenue (In USD)",
        "numberPrefix": "$",
        "theme": "fint",
        "legendPosition": "right"
    },
    "categories": [
        {
            "category": [
                {
                    "label": "Q1"
                },
                {
                    "label": "Q2"
                },
                {
                    "label": "Q3"
                },
                {
                    "label": "Q4"
                }
            ]
        }
    ],
    "dataset": [
        {
            "seriesname": "Last Year",
            "data": [
                {
                    "value": "10000"
                },
                {
                    "value": "11500"
                },
                {
                    "value": "12500"
                },
                {
                    "value": "15000"
                }
            ]
        },
        {
            "seriesname": "This Year",
            "data": [
                {
                    "value": "25400"
                },
                {
                    "value": "29800"
                },
                {
                    "value": "21800"
                },
                {
                    "value": "26800"
                }
            ]
        }
    ]
}
<html>
<head>
<title>My first chart using FusionCharts Suite XT</title>
<script type="text/javascript" src="http://static.fusioncharts.com/code/latest/fusioncharts.js"></script>
<script type="text/javascript" src="http://static.fusioncharts.com/code/latest/themes/fusioncharts.theme.fint.js?cacheBust=56"></script>
<script type="text/javascript">
FusionCharts.ready(function(){
var fusioncharts = new FusionCharts({
type: 'mscolumn2d',
renderAt: 'chart-container',
width: '500',
height: '300',
dataFormat: 'json',
dataSource: {
"chart": {
"caption": "Comparison of Quarterly Revenue",
"subCaption": "Last year Vs This year",
"xAxisname": "Quarter",
"yAxisName": "Revenue (In USD)",
"numberPrefix": "$",
"theme": "fint",
//Cosmetics for legend
"legendPosition": "right",
},
"categories": [{
"category": [{
"label": "Q1"
}, {
"label": "Q2"
}, {
"label": "Q3"
}, {
"label": "Q4"
}]
}],
"dataset": [{
"seriesname": "Last Year",
"data": [{
"value": "10000"
}, {
"value": "11500"
}, {
"value": "12500"
}, {
"value": "15000"
}]
}, {
"seriesname": "This Year",
"data": [{
"value": "25400"
}, {
"value": "29800"
}, {
"value": "21800"
}, {
"value": "26800"
}]
}]
}
}
);
fusioncharts.render();
});
</script>
</head>
<body>
<div id="chart-container">FusionCharts XT will load here!</div>
</body>
</html>The attribute to set legend position is as mentioned below.
| Attribute Name | Description |
|---|---|
|
The legend can be plotted at two positions on the chart - below the chart for value |
|
The legend can be made drag-able by setting this attribute to |
Configuring legend icon size
A multi-series column 2D chart with legend icon size changed to ‘2’ looks as below:
{
    "chart": {
        "caption": "Comparison of Quarterly Revenue",
        "subCaption": "Last year Vs This year",
        "xAxisname": "Quarter",
        "yAxisName": "Revenue (In USD)",
        "numberPrefix": "$",
        "theme": "fint",
        "legendIconScale": "2"
    },
    "categories": [
        {
            "category": [
                {
                    "label": "Q1"
                },
                {
                    "label": "Q2"
                },
                {
                    "label": "Q3"
                },
                {
                    "label": "Q4"
                }
            ]
        }
    ],
    "dataset": [
        {
            "seriesname": "Last Year",
            "data": [
                {
                    "value": "10000"
                },
                {
                    "value": "11500"
                },
                {
                    "value": "12500"
                },
                {
                    "value": "15000"
                }
            ]
        },
        {
            "seriesname": "This Year",
            "data": [
                {
                    "value": "25400"
                },
                {
                    "value": "29800"
                },
                {
                    "value": "21800"
                },
                {
                    "value": "26800"
                }
            ]
        }
    ]
}
<html>
<head>
<title>My first chart using FusionCharts Suite XT</title>
<script type="text/javascript" src="http://static.fusioncharts.com/code/latest/fusioncharts.js"></script>
<script type="text/javascript" src="http://static.fusioncharts.com/code/latest/themes/fusioncharts.theme.fint.js?cacheBust=56"></script>
<script type="text/javascript">
FusionCharts.ready(function(){
var fusioncharts = new FusionCharts({
type: 'mscolumn2d',
renderAt: 'chart-container',
width: '500',
height: '300',
dataFormat: 'json',
dataSource: {
"chart": {
"caption": "Comparison of Quarterly Revenue",
"subCaption": "Last year Vs This year",
"xAxisname": "Quarter",
"yAxisName": "Revenue (In USD)",
"numberPrefix": "$",
"theme": "fint",
//Increasing scale of legend icons
"legendIconScale": "2"
},
"categories": [{
"category": [{
"label": "Q1"
}, {
"label": "Q2"
}, {
"label": "Q3"
}, {
"label": "Q4"
}]
}],
"dataset": [{
"seriesname": "Last Year",
"data": [{
"value": "10000"
}, {
"value": "11500"
}, {
"value": "12500"
}, {
"value": "15000"
}]
}, {
"seriesname": "This Year",
"data": [{
"value": "25400"
}, {
"value": "29800"
}, {
"value": "21800"
}, {
"value": "26800"
}]
}]
}
}
);
fusioncharts.render();
});
</script>
</head>
<body>
<div id="chart-container">FusionCharts XT will load here!</div>
</body>
</html>The attribute to configure legend icon size is detailed below:
| Attribute Name | Description |
|---|---|
|
Scaling of legend icon is possible in FusionCharts XT. This attribute lets you control the size of legend icon with valid values from |
Drawing a custom legend icon shape
A multi-series column 2D chart with a custom legend icon shape looks as below:
{
    "chart": {
        "caption": "Comparison of Quarterly Revenue",
        "subCaption": "FY2012-13 versus FY2013-14",
        "xAxisname": "Quarter",
        "yAxisName": "Revenue",
        "numberPrefix": "$",
        "theme": "fint",
        "legendBgAlpha": "0",
        "legendBorderAlpha": "0",
        "legendShadow": "0",
        "legendItemFontSize": "10",
        "legendItemFontColor": "#666666",
        "drawCustomLegendIcon": "1",
        "legendIconAlpha": "50",
        "legendIconBorderColor": "#123456",
        "legendIconBorderThickness": "3",
        "legendIconSides": "5",
        "legendIconStartAngle": "60"
    },
    "categories": [
        {
            "category": [
                {
                    "label": "Q1"
                },
                {
                    "label": "Q2"
                },
                {
                    "label": "Q3"
                },
                {
                    "label": "Q4"
                }
            ]
        }
    ],
    "dataset": [
        {
            "seriesname": "FY2012-2013",
            "data": [
                {
                    "value": "10000"
                },
                {
                    "value": "11500"
                },
                {
                    "value": "12500"
                },
                {
                    "value": "15000"
                }
            ]
        },
        {
            "seriesname": "FY2013-2014",
            "data": [
                {
                    "value": "25400"
                },
                {
                    "value": "29800"
                },
                {
                    "value": "21800"
                },
                {
                    "value": "26800"
                }
            ]
        }
    ]
}
<html>
<head>
<title>My first chart using FusionCharts Suite XT</title>
<script type="text/javascript" src="http://static.fusioncharts.com/code/latest/fusioncharts.js"></script>
<script type="text/javascript" src="http://static.fusioncharts.com/code/latest/themes/fusioncharts.theme.fint.js?cacheBust=56"></script>
<script type="text/javascript">
FusionCharts.ready(function(){
var fusioncharts = new FusionCharts({
type: 'mscolumn2d',
renderAt: 'chart-container',
width: '500',
height: '300',
dataFormat: 'json',
dataSource: {
"chart": {
"caption": "Comparison of Quarterly Revenue",
"subCaption": "FY2012-13 versus FY2013-14",
"xAxisname": "Quarter",
"yAxisName": "Revenue",
"numberPrefix": "$",
"theme": "fint",
"legendBgAlpha": "0",
"legendBorderAlpha": "0",
"legendShadow": "0",
"legendItemFontSize": "10",
"legendItemFontColor": "#666666",
//New attributes for drawing a custom legend icon.
"drawCustomLegendIcon": "1",
"legendIconAlpha": "50",
"legendIconBorderColor": "#123456",
"legendIconBorderThickness": "3",
"legendIconSides": "5",
"legendIconStartAngle": "60"
},
"categories": [{
"category": [{
"label": "Q1"
}, {
"label": "Q2"
}, {
"label": "Q3"
}, {
"label": "Q4"
}]
}],
"dataset": [{
"seriesname": "FY2012-2013",
"data": [{
"value": "10000"
}, {
"value": "11500"
}, {
"value": "12500"
}, {
"value": "15000"
}]
}, {
"seriesname": "FY2013-2014",
"data": [{
"value": "25400"
}, {
"value": "29800"
}, {
"value": "21800"
}, {
"value": "26800"
}]
}]
}
}
);
fusioncharts.render();
});
</script>
</head>
<body>
<div id="chart-container">FusionCharts XT will load here!</div>
</body>
</html>Given below are the attributes used to draw a custom legend icon shape:
| Attribute Name | Description |
|---|---|
|
Sets whether drawing a custom legend icon will be enabled. Setting this attribute to |
|
Sets the hex color code for the border of the legend icon. By default, it is assigned the data plot border color. |
|
Sets the hex color code for the background of the legend icon. By default, it is assigned the data plot fill color. |
|
Sets the legend icon transparency. This attribute takes values between |
|
Sets the legend icon background transparency. This attribute takes values between |
|
Sets the number of sides for the legend icon. The default value is 4. |
|
Sets the thickness of the legend icon border. The default value is 1. |
|
Sets the starting angle for drawing the legend icon. The default value is 45. |
Customizing legend scroll bar
If you have multiple data items in a multi-series chart, the legend automatically displays a scroll bar.
A multi-series column 2D chart with customized cosmetic properties of the legend scroll bar looks as below:
{
    "chart": {
        "caption": "Letters Used in a Novel",
        "formatnumberscale": "0",
        "showBorder": "0",
        "showLegend": "1",
        "theme": "fint",
        "showPercentValues": "1",
        "showPercentInToolTip": "0",
        "legendPosition": "right",
        "legendCaption": "Alphabet Used: ",
        "legendScrollBgColor": "#cccccc",
        "legendScrollBarColor": "#999999"
    },
    "data": [
        {
            "label": "A",
            "value": "91852"
        },
        {
            "label": "B",
            "value": "51852"
        },
        {
            "label": "C",
            "value": "88168"
        },
        {
            "label": "D",
            "value": "73897"
        },
        {
            "label": "E",
            "value": "93933"
        },
        {
            "label": "F",
            "value": "19289"
        },
        {
            "label": "G",
            "value": "79623"
        },
        {
            "label": "H",
            "value": "48262"
        },
        {
            "label": "I",
            "value": "29162"
        },
        {
            "label": "J",
            "value": "96878"
        },
        {
            "label": "K",
            "value": "81241"
        },
        {
            "label": "L",
            "value": "40652",
            "issliced": "1"
        },
        {
            "label": "M",
            "value": "37581",
            "issliced": "1"
        },
        {
            "label": "N",
            "value": "2882"
        },
        {
            "label": "O",
            "value": "746"
        },
        {
            "label": "P",
            "value": "7155"
        },
        {
            "label": "Q",
            "value": "12072"
        },
        {
            "label": "R",
            "value": "45608"
        },
        {
            "label": "S",
            "value": "72570"
        },
        {
            "label": "T",
            "value": "44799"
        },
        {
            "label": "U",
            "value": "71887"
        },
        {
            "label": "V",
            "value": "78170"
        },
        {
            "label": "W",
            "value": "94345"
        },
        {
            "label": "X",
            "value": "5434"
        },
        {
            "label": "Y",
            "value": "34355"
        },
        {
            "label": "Z",
            "value": "2323"
        }
    ]
}
<html>
<head>
<title>My first chart using FusionCharts Suite XT</title>
<script type="text/javascript" src="http://static.fusioncharts.com/code/latest/fusioncharts.js"></script>
<script type="text/javascript" src="http://static.fusioncharts.com/code/latest/themes/fusioncharts.theme.fint.js?cacheBust=56"></script>
<script type="text/javascript">
FusionCharts.ready(function(){
var fusioncharts = new FusionCharts({
type: 'pie2d',
renderAt: 'chart-container',
width: '500',
height: '400',
dataFormat: 'json',
dataSource: {
"chart": {
"caption": "Letters Used in a Novel",
"formatnumberscale": "0",
"showBorder": "0",
"showLegend": "1",
"theme": "fint",
"showPercentValues": "1",
"showPercentInToolTip": "0",
//Setting legend to appear on right side
"legendPosition": "right",
//Caption for legend
"legendCaption": "Alphabet Used: ",
//Customization for legend scroll bar cosmetics
"legendScrollBgColor": "#cccccc",
"legendScrollBarColor": "#999999"
},
"data": [{
"label": "A",
"value": "91852"
}, {
"label": "B",
"value": "51852"
}, {
"label": "C",
"value": "88168"
}, {
"label": "D",
"value": "73897"
}, {
"label": "E",
"value": "93933"
}, {
"label": "F",
"value": "19289"
}, {
"label": "G",
"value": "79623"
}, {
"label": "H",
"value": "48262"
}, {
"label": "I",
"value": "29162"
}, {
"label": "J",
"value": "96878"
}, {
"label": "K",
"value": "81241"
}, {
"label": "L",
"value": "40652",
"issliced": "1"
}, {
"label": "M",
"value": "37581",
"issliced": "1"
}, {
"label": "N",
"value": "2882"
}, {
"label": "O",
"value": "746"
}, {
"label": "P",
"value": "7155"
}, {
"label": "Q",
"value": "12072"
}, {
"label": "R",
"value": "45608"
}, {
"label": "S",
"value": "72570"
}, {
"label": "T",
"value": "44799"
}, {
"label": "U",
"value": "71887"
}, {
"label": "V",
"value": "78170"
}, {
"label": "W",
"value": "94345"
}, {
"label": "X",
"value": "5434"
}, {
"label": "Y",
"value": "34355"
}, {
"label": "Z",
"value": "2323"
}]
}
}
);
fusioncharts.render();
});
</script>
</head>
<body>
<div id="chart-container">FusionCharts XT will load here!</div>
</body>
</html>The list of the attributes used to customize cosmetic properties of the legend scroll bar is mentioned below:
| Attribute Name | Description |
|---|---|
|
Sets the background color of the scroll bar. Accepts hex code. e.g. |
Reversing legend order
A multi-series column 2D chart with the order of legend items reversed looks as below:
{
    "chart": {
        "caption": "Comparison of Quarterly Revenue",
        "subCaption": "Last year Vs This year",
        "xAxisname": "Quarter",
        "yAxisName": "Revenue (In USD)",
        "numberPrefix": "$",
        "theme": "fint",
        "legendBgColor": "#CCCCCC",
        "legendBgAlpha": "20",
        "legendBorderColor": "#666666",
        "legendBorderThickness": "1",
        "legendBorderAlpha": "40",
        "legendShadow": "1",
        "reverseLegend": "1"
    },
    "categories": [
        {
            "category": [
                {
                    "label": "Q1"
                },
                {
                    "label": "Q2"
                },
                {
                    "label": "Q3"
                },
                {
                    "label": "Q4"
                }
            ]
        }
    ],
    "dataset": [
        {
            "seriesname": "Last Year",
            "data": [
                {
                    "value": "10000"
                },
                {
                    "value": "11500"
                },
                {
                    "value": "12500"
                },
                {
                    "value": "15000"
                }
            ]
        },
        {
            "seriesname": "This Year",
            "data": [
                {
                    "value": "25400"
                },
                {
                    "value": "29800"
                },
                {
                    "value": "21800"
                },
                {
                    "value": "26800"
                }
            ]
        }
    ]
}
<html>
<head>
<title>My first chart using FusionCharts Suite XT</title>
<script type="text/javascript" src="http://static.fusioncharts.com/code/latest/fusioncharts.js"></script>
<script type="text/javascript" src="http://static.fusioncharts.com/code/latest/themes/fusioncharts.theme.fint.js?cacheBust=56"></script>
<script type="text/javascript">
FusionCharts.ready(function(){
var fusioncharts = new FusionCharts({
type: 'mscolumn2d',
renderAt: 'chart-container',
width: '500',
height: '300',
dataFormat: 'json',
dataSource: {
"chart": {
"caption": "Comparison of Quarterly Revenue",
"subCaption": "Last year Vs This year",
"xAxisname": "Quarter",
"yAxisName": "Revenue (In USD)",
"numberPrefix": "$",
"theme": "fint",
//Cosmetics for legend
"legendBgColor": "#CCCCCC",
"legendBgAlpha": "20",
"legendBorderColor": "#666666",
"legendBorderThickness": "1",
"legendBorderAlpha": "40",
"legendShadow": "1",
//Reverse the order of items in legend
"reverseLegend": "1"
},
"categories": [{
"category": [{
"label": "Q1"
}, {
"label": "Q2"
}, {
"label": "Q3"
}, {
"label": "Q4"
}]
}],
"dataset": [{
"seriesname": "Last Year",
"data": [{
"value": "10000"
}, {
"value": "11500"
}, {
"value": "12500"
}, {
"value": "15000"
}]
}, {
"seriesname": "This Year",
"data": [{
"value": "25400"
}, {
"value": "29800"
}, {
"value": "21800"
}, {
"value": "26800"
}]
}]
}
}
);
fusioncharts.render();
});
</script>
</head>
<body>
<div id="chart-container">FusionCharts XT will load here!</div>
</body>
</html>The attribute to reverse legend order is mentioned below:
| Attribute Name | Description |
|---|---|
|
You can reverse the ordering of datasets in the legend by setting this attribute to |
Hiding legend
A multi-series column 2D chart with legend hidden looks as below:
{
    "chart": {
        "caption": "Comparison of Quarterly Revenue",
        "subCaption": "Last year Vs This year",
        "xAxisname": "Quarter",
        "yAxisName": "Amount (In USD)",
        "numberPrefix": "$",
        "theme": "fint",
        "showLegend": "0"
    },
    "categories": [
        {
            "category": [
                {
                    "label": "Q1"
                },
                {
                    "label": "Q2"
                },
                {
                    "label": "Q3"
                },
                {
                    "label": "Q4"
                }
            ]
        }
    ],
    "dataset": [
        {
            "seriesname": "Last Year",
            "data": [
                {
                    "value": "10000"
                },
                {
                    "value": "11500"
                },
                {
                    "value": "12500"
                },
                {
                    "value": "15000"
                }
            ]
        },
        {
            "seriesname": "This Year",
            "data": [
                {
                    "value": "25400"
                },
                {
                    "value": "29800"
                },
                {
                    "value": "21800"
                },
                {
                    "value": "26800"
                }
            ]
        }
    ]
}
<html>
<head>
<title>My first chart using FusionCharts Suite XT</title>
<script type="text/javascript" src="http://static.fusioncharts.com/code/latest/fusioncharts.js"></script>
<script type="text/javascript" src="http://static.fusioncharts.com/code/latest/themes/fusioncharts.theme.fint.js?cacheBust=56"></script>
<script type="text/javascript">
FusionCharts.ready(function(){
var fusioncharts = new FusionCharts({
type: 'mscolumn2d',
renderAt: 'chart-container',
width: '500',
height: '300',
dataFormat: 'json',
dataSource: {
"chart": {
"caption": "Comparison of Quarterly Revenue",
"subCaption": "Last year Vs This year",
"xAxisname": "Quarter",
"yAxisName": "Amount (In USD)",
"numberPrefix": "$",
"theme": "fint",
//Hiding the legend
"showLegend": "0"
},
"categories": [{
"category": [{
"label": "Q1"
}, {
"label": "Q2"
}, {
"label": "Q3"
}, {
"label": "Q4"
}]
}],
"dataset": [{
"seriesname": "Last Year",
"data": [{
"value": "10000"
}, {
"value": "11500"
}, {
"value": "12500"
}, {
"value": "15000"
}]
}, {
"seriesname": "This Year",
"data": [{
"value": "25400"
}, {
"value": "29800"
}, {
"value": "21800"
}, {
"value": "26800"
}]
}]
}
}
);
fusioncharts.render();
});
</script>
</head>
<body>
<div id="chart-container">FusionCharts XT will load here!</div>
</body>
</html>The attribute to show or hide a legend is mentioned in the table below:
| Attribute Name | Description |
|---|---|
|
Whether to show legend on the chart. Set it to |
Hiding series upon loading
A multi-series column 2D chart with one data series hidden looks as below:
{
    "chart": {
        "caption": "Comparison of Quarterly Revenue",
        "subCaption": "Last year Vs This year",
        "xAxisname": "Quarter",
        "yAxisName": "Revenue (In USD)",
        "numberPrefix": "$",
        "theme": "fint",
        "legendBgColor": "#CCCCCC",
        "legendBgAlpha": "20",
        "legendBorderColor": "#666666",
        "legendBorderThickness": "1",
        "legendBorderAlpha": "40",
        "legendShadow": "1"
    },
    "categories": [
        {
            "category": [
                {
                    "label": "Q1"
                },
                {
                    "label": "Q2"
                },
                {
                    "label": "Q3"
                },
                {
                    "label": "Q4"
                }
            ]
        }
    ],
    "dataset": [
        {
            "seriesname": "Last Year",
            "initiallyHidden": "1",
            "data": [
                {
                    "value": "10000"
                },
                {
                    "value": "11500"
                },
                {
                    "value": "12500"
                },
                {
                    "value": "15000"
                }
            ]
        },
        {
            "seriesname": "This Year",
            "data": [
                {
                    "value": "25400"
                },
                {
                    "value": "29800"
                },
                {
                    "value": "21800"
                },
                {
                    "value": "26800"
                }
            ]
        }
    ]
}
<html>
<head>
<title>My first chart using FusionCharts Suite XT</title>
<script type="text/javascript" src="http://static.fusioncharts.com/code/latest/fusioncharts.js"></script>
<script type="text/javascript" src="http://static.fusioncharts.com/code/latest/themes/fusioncharts.theme.fint.js?cacheBust=56"></script>
<script type="text/javascript">
FusionCharts.ready(function(){
var fusioncharts = new FusionCharts({
type: 'mscolumn2d',
renderAt: 'chart-container',
width: '500',
height: '300',
dataFormat: 'json',
dataSource: {
"chart": {
"caption": "Comparison of Quarterly Revenue",
"subCaption": "Last year Vs This year",
"xAxisname": "Quarter",
"yAxisName": "Revenue (In USD)",
"numberPrefix": "$",
"theme": "fint",
//Cosmetics for legend
"legendBgColor": "#CCCCCC",
"legendBgAlpha": "20",
"legendBorderColor": "#666666",
"legendBorderThickness": "1",
"legendBorderAlpha": "40",
"legendShadow": "1"
},
"categories": [{
"category": [{
"label": "Q1"
}, {
"label": "Q2"
}, {
"label": "Q3"
}, {
"label": "Q4"
}]
}],
"dataset": [{
"seriesname": "Last Year",
"initiallyHidden": "1",
"data": [{
"value": "10000"
}, {
"value": "11500"
}, {
"value": "12500"
}, {
"value": "15000"
}]
}, {
"seriesname": "This Year",
"data": [{
"value": "25400"
}, {
"value": "29800"
}, {
"value": "21800"
}, {
"value": "26800"
}]
}]
}
}
);
fusioncharts.render();
});
</script>
</head>
<body>
<div id="chart-container">FusionCharts XT will load here!</div>
</body>
</html>Given below is the attribute used to initially hide a dataset on chart loading:
| Attribute Name | Description |
|---|---|
|
Works from the |
Customizing legend appearance
A multi-series column 2D chart legend with customized appearance looks as below:
{
    "chart": {
        "caption": "Comparison of Quarterly Revenue",
        "subCaption": "Last year Vs This year",
        "xAxisname": "Quarter",
        "yAxisName": "Revenue (In USD)",
        "numberPrefix": "$",
        "theme": "fint",
        "legendBgColor": "#CCCCCC",
        "legendBgAlpha": "20",
        "legendBorderColor": "#666666",
        "legendBorderThickness": "1",
        "legendBorderAlpha": "40",
        "legendShadow": "1"
    },
    "categories": [
        {
            "category": [
                {
                    "label": "Q1"
                },
                {
                    "label": "Q2"
                },
                {
                    "label": "Q3"
                },
                {
                    "label": "Q4"
                }
            ]
        }
    ],
    "dataset": [
        {
            "seriesname": "Last Year",
            "data": [
                {
                    "value": "10000"
                },
                {
                    "value": "11500"
                },
                {
                    "value": "12500"
                },
                {
                    "value": "15000"
                }
            ]
        },
        {
            "seriesname": "This Year",
            "data": [
                {
                    "value": "25400"
                },
                {
                    "value": "29800"
                },
                {
                    "value": "21800"
                },
                {
                    "value": "26800"
                }
            ]
        }
    ]
}
<html>
<head>
<title>My first chart using FusionCharts Suite XT</title>
<script type="text/javascript" src="http://static.fusioncharts.com/code/latest/fusioncharts.js"></script>
<script type="text/javascript" src="http://static.fusioncharts.com/code/latest/themes/fusioncharts.theme.fint.js?cacheBust=56"></script>
<script type="text/javascript">
FusionCharts.ready(function(){
var fusioncharts = new FusionCharts({
type: 'mscolumn2d',
renderAt: 'chart-container',
width: '500',
height: '300',
dataFormat: 'json',
dataSource: {
"chart": {
"caption": "Comparison of Quarterly Revenue",
"subCaption": "Last year Vs This year",
"xAxisname": "Quarter",
"yAxisName": "Revenue (In USD)",
"numberPrefix": "$",
"theme": "fint",
//Cosmetics for legend
"legendBgColor": "#CCCCCC",
"legendBgAlpha": "20",
"legendBorderColor": "#666666",
"legendBorderThickness": "1",
"legendBorderAlpha": "40",
"legendShadow": "1"
},
"categories": [{
"category": [{
"label": "Q1"
}, {
"label": "Q2"
}, {
"label": "Q3"
}, {
"label": "Q4"
}]
}],
"dataset": [{
"seriesname": "Last Year",
"data": [{
"value": "10000"
}, {
"value": "11500"
}, {
"value": "12500"
}, {
"value": "15000"
}]
}, {
"seriesname": "This Year",
"data": [{
"value": "25400"
}, {
"value": "29800"
}, {
"value": "21800"
}, {
"value": "26800"
}]
}]
}
}
);
fusioncharts.render();
});
</script>
</head>
<body>
<div id="chart-container">FusionCharts XT will load here!</div>
</body>
</html>Given below is the list of attributes used to customize the legend appearance:
| Attribute Name | Description |
|---|---|
|
Background color for the legend. Accepts hex code. e.g. |
|
Background alpha for the legend. It can take values from |
|
Border Color for the legend. Accepts hex code. e.g. |
|
Border thickness for the legend (in pixels). |
|
Border alpha for the legend. It can take values from |
|
Whether to show a shadow for legend. Set it to |
|
If you’ve too many items on the legend, a scroll bar shows up on the same. This attribute lets you configure the background color of the scroll bar. Accepts hex code. e.g. |
|
Sets the legend caption horizontal alignment with valid values of |
Customizing legend font cosmetics
A multi-series column 2D chart legend with customized font cosmetics looks as below:
{
    "chart": {
        "caption": "Comparison of Quarterly Revenue",
        "subCaption": "Last year Vs This year",
        "xAxisname": "Quarter",
        "yAxisName": "Amount (In USD)",
        "numberPrefix": "$",
        "theme": "fint",
        "legendPosition": "right",
        "legendCaption": "Which year?",
        "legendCaptionBold": "1",
        "legendCaptionFont": "Arial",
        "legendCaptionFontSize": "14",
        "legendCaptionFontColor": "#333333",
        "legendItemFontBold": "0",
        "legendItemFont": "Arial",
        "legendItemFontSize": "11",
        "legendItemFontColor": "#666666",
        "legendItemHoverFontColor": "#000000",
        "legendCaptionAlignment": "left",
        "legendItemHiddenColor": "#e8e8e8"
    },
    "categories": [
        {
            "category": [
                {
                    "label": "Q1"
                },
                {
                    "label": "Q2"
                },
                {
                    "label": "Q3"
                },
                {
                    "label": "Q4"
                }
            ]
        }
    ],
    "dataset": [
        {
            "seriesname": "Last Year",
            "data": [
                {
                    "value": "10000"
                },
                {
                    "value": "11500"
                },
                {
                    "value": "12500"
                },
                {
                    "value": "15000"
                }
            ]
        },
        {
            "seriesname": "This Year",
            "data": [
                {
                    "value": "25400"
                },
                {
                    "value": "29800"
                },
                {
                    "value": "21800"
                },
                {
                    "value": "26800"
                }
            ]
        }
    ]
}
<html>
<head>
<title>My first chart using FusionCharts Suite XT</title>
<script type="text/javascript" src="http://static.fusioncharts.com/code/latest/fusioncharts.js"></script>
<script type="text/javascript" src="http://static.fusioncharts.com/code/latest/themes/fusioncharts.theme.fint.js?cacheBust=56"></script>
<script type="text/javascript">
FusionCharts.ready(function(){
var fusioncharts = new FusionCharts({
type: 'mscolumn2d',
renderAt: 'chart-container',
width: '500',
height: '300',
dataFormat: 'json',
dataSource: {
"chart": {
"caption": "Comparison of Quarterly Revenue",
"subCaption": "Last year Vs This year",
"xAxisname": "Quarter",
"yAxisName": "Amount (In USD)",
"numberPrefix": "$",
"theme": "fint",
//Set legend to appear at right side of chart
"legendPosition": "right",
//Set a text caption for legend
"legendCaption": "Which year?",
"legendCaptionBold": "1",
"legendCaptionFont": "Arial",
"legendCaptionFontSize": "14",
"legendCaptionFontColor": "#333333",
//Configuration for legend font
"legendItemFontBold": "0",
"legendItemFont": "Arial",
"legendItemFontSize": "11",
"legendItemFontColor": "#666666",
"legendItemHoverFontColor": "#000000",
"legendCaptionAlignment": "left",
//Color of hidden legend item
"legendItemHiddenColor": "#e8e8e8"
},
"categories": [{
"category": [{
"label": "Q1"
}, {
"label": "Q2"
}, {
"label": "Q3"
}, {
"label": "Q4"
}]
}],
"dataset": [{
"seriesname": "Last Year",
"data": [{
"value": "10000"
}, {
"value": "11500"
}, {
"value": "12500"
}, {
"value": "15000"
}]
}, {
"seriesname": "This Year",
"data": [{
"value": "25400"
}, {
"value": "29800"
}, {
"value": "21800"
}, {
"value": "26800"
}]
}]
}
}
);
fusioncharts.render();
});
</script>
</head>
<body>
<div id="chart-container">FusionCharts XT will load here!</div>
</body>
</html>Given below is the list of attributes used to customize the legend font cosmetics:
| Attribute Name | Description |
|---|---|
|
Sets legend item font, e.g. |
|
Sets legend item font size, with values ranging from |
|
Sets legend item font color in hex code, e.g. |
|
Whether legend keys should be displayed in bold. Set |
|
Sets legend item font color on hover in hex code, e.g. |
|
Sets legend caption font, e.g. |
|
Sets legend caption font size, with values ranging from |
|
Whether legend caption should be displayed in bold. Set |