Loading
Create Charts using Node.js, ExpressJS and Mongodb
In the recent years an unexpected programming language has been dominating the server side scene. This programming language was only being used for client side programming. It is none other than our very own JavaScript. The change in the fortunes of JavaScript can be attributed to the introduction of a server side framework called Node.js.
But what is this Node.js? Quoting from their official site:
Node.js is a platform built on Chrome’s JavaScript runtime for easily building fast, scalable network applications. Node.js uses an event-driven, non-blocking I/O model that makes it lightweight and efficient, perfect for data-intensive real-time applications that run across distributed devices.
There are multiple web frameworks built on top of Node.js leveraging its platform. Few famous examples are Express and SailsJS.
In this post we will see how we can create dynamic charts using ExpressJS and MongoDB. ExpressJS is a minimalistic framework for Node.js which is used to create web applications. MongoDB is a NoSQL based data store which stores data in the form of collection of documents where each document is of custom JSON format called BSON.
In this section, you will be shown how to:
- Install Node.js
- Install ExpressJS
- Install MongoDB
- Populate data in MongoDB
- Create REST API for data retrieval
- Create views for rendering the chart
- Download source code
Installing Node.js
Download the relevant Node.js installer for your operating system from here and follow the instructions to install it on your system. For windows the installer will update the Path variable to include the location for the node executable.
To verify if the installation went fine:
- Open Command Terminal and run the following command:
$ node -vto get the version of the nodejs installed in your system. - Run the command node to open up a REPL (Read Evaluate Print Loop) console and try out a small command as shown below:
Installing ExpressJS
The libraries or frameworks leveraging Node platform are distributed in the form of packages and these packages can be installed using the Node Package Manager (npm) tool which comes with the Nodejs installation. ExpressJS is one such package. These packages can be installed globally or installed for specific application. Follow the steps below to install ExpressJS for a specific application:
- Create a new directory:
$ mkdir node-fusioncharts-demo - Change to the new directory
$ cd node-fusioncharts-demo - Install express for specific application
$ npm install express
After the installation you will find a new folder node_modules created. This is where all your application specific packages are stored.
Installing MongoDB
MongoDB is an open-source, document database designed for ease of development and scaling. It stores data as a collection of documents where each document is stored in a custom JSON format called BSON. Relevant MongoDB distributions can be downloaded from here and installed in your systems.
Two very frequently used commands of MongoDB are: mongod and mongo .
- mongod: This command is used to run the MongoDB daemon which manages the data storage and retrieval. By default it runs on the port 27017.
- mongo: This command is used to run all our MongoDB queries. One can insert, retrieve, update and delete data as well as create indexes through this tool. It connects to the MongoDB daemon running on the port 27017
Populating data in MongoDB
For this article we are going to consider the variation of price of Petrol and Diesel for the year 2015 in Bangalore, India. We have obtained the fuel price from here. As MongoDB is a JSON based document store, the data to be populated is created in the form of an array of JSON objects as shown below:
[
  {
    "month": "Jan", "petrol" : 64.72, "diesel": 52.49
  },
  {
    "month": "Feb", "petrol" : 62.81, "diesel": 50.72
  },
  {
    "month": "Mar", "petrol" : 66.18, "diesel": 54.06
  },
  {
    "month": "Apr", "petrol" : 65.17, "diesel": 51.74
  },
  {
    "month": "May", "petrol" : 72.94, "diesel": 57.23
  },
  {
    "month": "Jun", "petrol" : 73.77, "diesel": 55.83
  },
  {
    "month": "Jul", "petrol" : 70.7, "diesel": 52.59
  },
  {
    "month": "Aug", "petrol" : 66.72, "diesel": 47.54
  },
  {
    "month": "Sept", "petrol" : 64.61, "diesel": 47.02
  }
]
Each JSON object contains 3 properties: Month, Price of Petrol and Price of Diesel for that month. To populate this data into the MongoDB we make use of another tool called: mongoimport provided by MongoDB. To this tool we provide the following information:
- name of the database (
-d fusion_demo) - name of the collection (
-c fuel_price) - type of the input data (
--type json) - location of the file containing data (
--file data.json) - option to indicate input is JSON array (
--jsonArray)
$ mongoimport -d fusion_demo -c fuel_price --type json --file data.json --jsonArray

connected to: 127.0.0.1
2015-09-01T21:02:42.210+0530 imported 9 objects
Let us confirm if the data really got inserted by running a few queries as shown below:
MongoDB shell version: 2.6.7
connecting to: test
> use fusion_demo
switched to db fusion_demo
> show collections
fuel_price
system.indexes
> db.fuel_price.find();
{ "_id" : ObjectId("55e5c5191873f247b61bd91b"), "month" : "Jan", "petrol" : 64.72, "diesel" : 52.49 }
{ "_id" : ObjectId("55e5c51a1873f247b61bd91c"), "month" : "Feb", "petrol" : 62.81, "diesel" : 50.72 }
{ "_id" : ObjectId("55e5c51a1873f247b61bd91d"), "month" : "Mar", "petrol" : 66.18, "diesel" : 54.06 }
{ "_id" : ObjectId("55e5c51a1873f247b61bd91e"), "month" : "Apr", "petrol" : 65.17, "diesel" : 51.74 }
{ "_id" : ObjectId("55e5c51a1873f247b61bd91f"), "month" : "May", "petrol" : 72.94, "diesel" : 57.23 }
{ "_id" : ObjectId("55e5c51a1873f247b61bd920"), "month" : "Jun", "petrol" : 73.77, "diesel" : 55.83 }
{ "_id" : ObjectId("55e5c51a1873f247b61bd921"), "month" : "Jul", "petrol" : 70.7, "diesel" : 52.59 }
{ "_id" : ObjectId("55e5c51a1873f247b61bd922"), "month" : "Aug", "petrol" : 66.72, "diesel" : 47.54 }
{ "_id" : ObjectId("55e5c51a1873f247b61bd923"), "month" : "Sept", "petrol" : 64.61, "diesel" : 47.02 }
>
So now we have the required data in our db. Let us now see how to create REST API using ExpressJS to consume the data from MongoDB.
Creating REST API for data retrieval
If you are familiar with Java, you would remember using a MySQL Connector Jar to connect to MySQL from Java or use a MongoDB connector to connect to MongoDB. Similarly in Nodejs we have a connector which is distributed as mongodb node package. Install it by using the command: $ npm install mongodb
Let us develop the REST API by following the steps listed below:
- Import the express and mongodb packages to be used in the application
- Connect to MongoDB instance running locally
- Implement method to fetch the data from Database
- Create express server and REST API end-point
- Launch the express app on a port
Step 1 : Import the Express and Mongodb Packages to be used in the Application
We make use of the require() function to import the required packages by passing the name of the package.
//import express package
var express = require("express");

//import mongodb package
var mongodb = require("mongodb");
Step 2 : Connect to MongoDB instance running locally
We first have to build the connection url which consists of hostname, port and database name as shown below:
//MongoDB connection URL - mongodb://host:port/dbName
    var dbHost = "mongodb://localhost:27017/fusion_demo";

    Use the MongoClient to connect to the db as shown below:
    //DB Object
    var dbObject;

    //get instance of MongoClient to establish connection
    var MongoClient = mongodb.MongoClient;

    //Connecting to the Mongodb instance.
    //Make sure your mongodb daemon mongod is running on port 27017 on localhost
    MongoClient.connect(dbHost, function(err, db){
      if ( err ) throw err;
      dbObject = db;
    });
Step 3 : Implement method to fetch the data from Database
While we implement the method to fetch db, we also need to parse and construct the object so that we are able to use it for rendering the multi series line chart. The multi series line chart we are going to draw requires an array of labels, multiple arrays of values where each array indicates a series. The data we retrieve from db is an array of objects of the below form:
{ "_id" : ObjectId("55e5c5191873f247b61bd91b"), "month" : "Jan", "petrol" : 64.72, "diesel" : 52.49}We have to transform the above into the form which will help us bind to the chart:
{
  "dataset" : [
    {
      "seriesname" :"Petrol Prices",
      "data" : [{"value": 64.72}]
    },
    {
      "seriesname" :"Diesel Prices",
      "data" : [{"value": 52.49}]
    }
The above form will help us to extract categories array as well as data set very easily. Let us look at the method implementation below:
function getData(){
      //use the find() API and pass an empty query object to retrieve all records
      dbObject.collection("fuel_price").find({}).toArray(function(err, docs){
        if ( err ) throw err;
        var monthArray = [];
        var petrolPrices = [];
        var dieselPrices = [];

        for ( index in docs){
          var doc = docs[index];
          //category array
          var month = doc['month'];
          //series 1 values array
          var petrol = doc['petrol'];
          //series 2 values array
          var diesel = doc['diesel'];
          monthArray.push({"label": month});
          petrolPrices.push({"value" : petrol});
          dieselPrices.push({"value" : diesel});
        }

        var dataset = [
          {
            "seriesname" : "Petrol Price",
            "data" : petrolPrices
          },
          {
            "seriesname" : "Diesel Price",
            "data": dieselPrices
          }
        ];

        var response = {
          "dataset" : dataset,
          "categories" : monthArray
        };
      });
    }
Step 4 : Create Express Server and REST API end-point
Let us expose the REST API at the URL /fuelPrices. We will modify the getData() method we defined in Step 3 by adding an additional parameter to the method. This additional parameter is the response object. We are going to write the JSON object created in getData() method to the response object so that it is sent to the client invoking the API.
//create express app
var app = express();
app.get("/fuelPrices", function(req, res){
  getData(res);
});
Step 5 : Launch the Express App on some Port
Express app is launched by listening to some unused port as shown below:
Let us launch this application using node by running the following command:
You will notice that the server is up on http://localhost:3300. Open the URL http://localhost:3300/fuelPrices in the browser to find the JSON response of the API.
Creating views for rendering the chart
Now that we have the back-end ready, let us focus on building the views for rendering the chart. We are going to use a template engine which will help us create dynamic HTML views. Using this template we can define parts of the page that will be populated by the data from the backend and rest will be statically defined. The template engine we would be using for this article is called Handlebars.
To get handlebars working with Express we need to install a node package express-handlebars which will help us to invoke the templates from express code. Let us install that package by running the command: npm install express-handlebars .
We will be creating the required templates in a views directory. This is the convention followed by express to look for view templates. We will create a base template which will contain the common parts of the page namely: css resource inclusions, header, footer, JavaScript inclusions. This base template is commonly called as a layout file. The other templates are rendered within this layout file. The base template OR the layout file is placed within the layouts folder.
Base template, main.handlebars, is constructed as shown below:
<!-- Filename: main.handlebars -->
<!DOCTYPE html>
<html>
<head>
    <meta charset="utf-8">
    <link rel="stylesheet" href="https://maxcdn.bootstrapcdn.com/bootstrap/3.3.5/css/bootstrap.min.css">
    <title>FusionCharts Sample</title>
</head>
<body>
    <div class="container">
      {{{body}}}
    </div>
    <script src="http://code.jquery.com/jquery-2.1.4.min.js" charset="utf-8"></script>
    <script src="https://maxcdn.bootstrapcdn.com/bootstrap/3.3.5/js/bootstrap.min.js"></script>
    <script src="https://cdnjs.cloudflare.com/AJAX/libs/handlebars.js/4.0.0/handlebars.js"></script>
    <script src="/public/js/fusioncharts_demo.js" charset="utf-8"></script>
    <script src="/public/js/fusioncharts.js"></script>
    <script src="/public/js/fusioncharts.charts.js"></script>
    <script src="/public/js/fusioncharts.theme.zune.js"></script>
</body>
</html>
The layout template is referring to a JavaScript resource: fusioncharts_demo.js which is placed under public/js folder. This JavaScript resource is where we are going to add our code to get data from backend and render that in a chart. We are going to place all FusionCharts JavaScript library in this folder.
Note: In the above we are making use of Bootstrap and jQuery in addition to our FusionCharts library
Let us now see the code for the template that will contain the chart. The name of this template file is chart.handlebars. In this template we will show the data both in tabular as well as graphical format. Before we look at the template definition, let us look at the directory structure we have created so far:
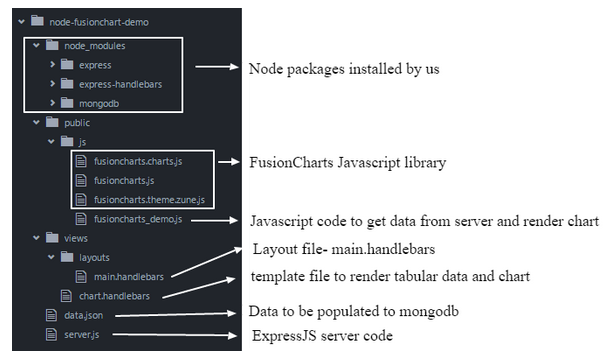
Let us get back to the expressjs server code i.e server.js and do the following:
- Setup handlebars template engine with main.handlebars as default layout.
<!-- Filename: main.handlebars -->
    <!DOCTYPE html>
    <html>
    <head>
        <meta charset="utf-8">
        <link rel="stylesheet" href="https://maxcdn.bootstrapcdn.com/bootstrap/3.3.5/css/bootstrap.min.css">
        <title>FusionCharts Sample</title>
    </head>
    <body>
        <div class="container">
          {{{body}}}
        </div>
        <script src="http://code.jquery.com/jquery-2.1.4.min.js" charset="utf-8"></script>
        <script src="https://maxcdn.bootstrapcdn.com/bootstrap/3.3.5/js/bootstrap.min.js"></script>
        <script src="https://cdnjs.cloudflare.com/AJAX/libs/handlebars.js/4.0.0/handlebars.js"></script>
        <script src="/public/js/fusioncharts_demo.js" charset="utf-8"></script>
        <script src="/public/js/fusioncharts.js"></script>
        <script src="/public/js/fusioncharts.charts.js"></script>
        <script src="/public/js/fusioncharts.theme.zune.js"></script>
    </body>
</html>- Defining an endpoint to serve static resources like JavaScript resources
A new endpoint to render the view:
Let us work on building the JavaScript code for making an AJAX call to get the data as shown below:
var chartData;
$(function(){
  $.AJAX({
    url: 'http://localhost:3300/fuelPrices',
    type: 'GET',
    success : function(data) {
      chartData = data;
      console.log(data);
    }
  });
});
We will build chart.handlebars in two parts:
- Build the relevant HTML to display the fuel price in a tabular form
- Build the JavaScript and HTML to display the fuel price in a line chart
Build the relevant HTML to display the fuel price in a tabular form
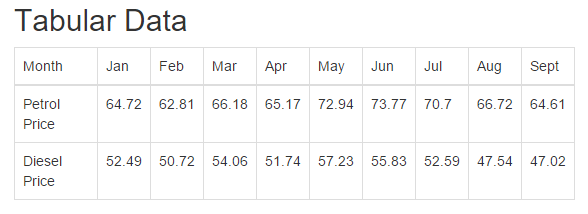
The aim of this HTML is to display the data in a tabular form as shown below:
| Month | Jan | Feb | Mar | Apr | ... |
|---|---|---|---|---|---|
Petro Price |
64.72 |
62.81 |
66.18 |
65.17 |
… |
Diesel Price |
52.49 |
50.72 |
54.06 |
51.74 |
… |
And for this we will make use of Handlebars template at the client side i.e we will process the handlebars templates in the client with the data we received after making an AJAX call to the server. Let us define the Handlebars template within in the <script> tag in the chart.handlebars file as shown below:
<!-- This is where we display the table -->
<div id="table-location">

</div>
<br/>
<!-- Location where the chart will be added -->
<div id="chart-location">

</div>
The placeholders identified by are handlebar constructs. Let us get back to the JavaScript AJAX call we had made. Within the success function we will use Handlebars.compile() to compile the client side template and then invoke the compiled template with the data obtained from server as shown below:
var template = Handlebars.compile($("#tabular-template").html());
$("#table-location").html(template(data));
If you want to see the app we have built so far in action, just run the following command from the app directory: node server.js. You will see Server up: http://localhost:3300 printed. Open the URL http://localhost:3300/ to see the table as shown in the below image:
Build the JavaScript and HTML to display the fuel price in a line chart
In this section we will add code for rendering the chart. Let us build the chart step-by-step as shown below:
- Create chart properties object
var chartProperties = {
    "caption": "Variation of Petrol and Diesel price in Bangalore",
    "numberprefix": "Rs",
    "xAxisName": "Month",
    "yAxisName": "Price"
};- Create categories array object
- Create FusionCharts object for multiseries line
var lineChart = new FusionCharts({
    type: 'msline',
    renderAt: 'chart-location',
    width: '100Ω',
    height: '600',
    dataFormat: 'json',
    dataSource: {
        chart: chartProperties,
        categories : categoriesArray,
        dataset : data["dataset"]
    }
});- Render the chart using the
render()API.
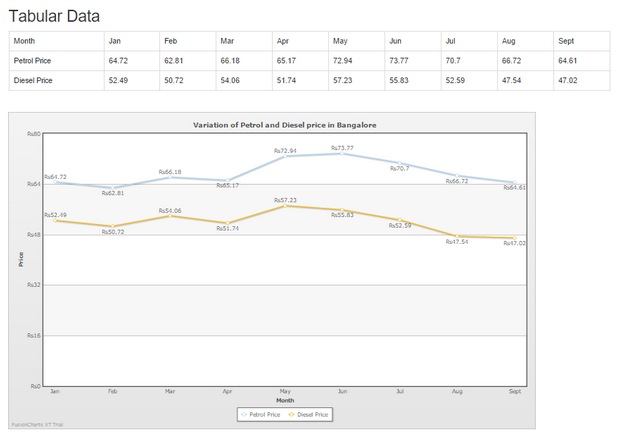
Let us load the URL http://localhost:3300/ in the browser to see both table and chart being displayed as shown in the image below:
Source Code Download
The complete app can be downloaded from here.