Loading
Create Drill-Down Charts using PHP and MySQL
Quite often, you will be required to let your user to drill-down from yearly data to quarterly data, quarterly data to monthly data (in a chart showing sales figures) or from categories to individual items (in a chart for a retail store). FusionCharts Suite XT makes this very easy with LinkedCharts, using which you can create unlimited levels of drill-down charts from a single data source in minutes.
In this tutorial we take a look at how to create a multi-level drill-down linked chart using PHP and MySQL.
Pre-requisites:
To get the code in this article working we need the below softwares installed and configured:
- Apache web server
- MySQL
- PHP
This stack is popularly called as *AMP(Apache MySQL PHP) stack and when you include the platform on which this stack is running then it becomes either WAMP (Windows Apache MySql PHP) or LAMP (Linux Apache MySQL PHP). So there are lots of vendors who bundle this stack and make it available for download.
Once the stack is set up properly:
-
Create a project folder called php-mysql-drill-down in the root directory of the web server. You should be able to browse to this folder via any web browser using the URL.
-
Create a blank file named index.php and save it in the php-mysql-drill-down folder.
Creating drill-down charts
As our sample, we will create a column 2D chart that lets the user drill-down from yearly to quarterly (for the selected year) to monthly (for the selected quarter of the selected year) data.
Step-1: Creating a MySQL database and seeding data into the tables
To create a MySQL database, you will be required to access the MySQL database server. For access to the MySQL database server, we log in using the username (usually root) and password configured during/after the installation. To log in to the MySQL database server, we can use any of the client-side MySQL tools like MySQL Workbench or use phpMyAdmin, which is installed by default with the *AMP stack.
Once we login to the database server, we will use the below commands to create a database for the drill-down sample.
Once the database is created and selected, it’s time to create the tables that we need for the drill-down sample. We would require three tables called
- monthly_sales: Having the monthly sale data
- quarterly_sales: Having the quarterly sale data
- yearly_sales: Having the yearly sale data
Now, let’s create the tables, using the code shown below:
--
-- Definition of table `monthly_sales`
--
CREATE TABLE `monthly_sales` (
  `Month` varchar(50) NOT NULL,
  `Sales` int(10) unsigned NOT NULL,
  `Year` int(10) unsigned NOT NULL,
  `Quarter` varchar(50) NOT NULL DEFAULT '',
  PRIMARY KEY (`Year`,`Quarter`,`Month`) USING BTREE
) ENGINE=InnoDB DEFAULT CHARSET=latin1;
--
-- Definition of table `quarterly_sales`
--
CREATE TABLE `quarterly_sales` (
  `Quarter` varchar(20) NOT NULL,
  `Sales` varchar(20) NOT NULL,
  `Year` varchar(20) NOT NULL
) ENGINE=InnoDB DEFAULT CHARSET=latin1;
--
-- Definition of table `yearly_sales`
--
CREATE TABLE `yearly_sales` (
  `Year` varchar(20) NOT NULL,
  `Sales` varchar(20) NOT NULL
) ENGINE=InnoDB DEFAULT CHARSET=latin1;
Once the tables are created, we’ll seed them with some data
--
-- Dumping data for table `monthly_sales`
--

/*!40000 ALTER TABLE `monthly_sales` DISABLE KEYS */;
INSERT INTO `monthly_sales` (`Month`,`Sales`,`Year`,`Quarter`) VALUES
 ('Feb',2300,2011,'Q1'),
 ('Jan',2000,2011,'Q1'),
 ('Mar',3200,2011,'Q1'),
 ('Apr',2800,2011,'Q2'),
 ('Jun',2350,2011,'Q2'),
 ('May',3000,2011,'Q2'),
 ('Aug',3000,2011,'Q3'),
 ('Jul',2850,2011,'Q3'),
 ('Sep',3500,2011,'Q3'),
 ('Dec',1250,2011,'Q4'),
 ('Nov',2895,2011,'Q4'),
 ('Oct',3000,2011,'Q4'),
 ('Feb',2345,2012,'Q1'),
 ('Jan',1585,2012,'Q1'),
 ('Mar',3070,2012,'Q1'),
 ('Apr',2856,2012,'Q2'),
 ('Jun',822,2012,'Q2'),
 ('May',2500,2012,'Q2'),
 ('Aug',3296,2012,'Q3'),
 ('Jul',1500,2012,'Q3'),
 ('Sep',3204,2012,'Q3'),
 ('Dec',2011,2012,'Q4'),
 ('Nov',3200,2012,'Q4'),
 ('Oct',3689,2012,'Q4'),
 ('Feb',500,2013,'Q1'),
 ('Jan',1200,2013,'Q1'),
 ('Mar',400,2013,'Q1'),
 ('Apr',900,2013,'Q2'),
 ('Jun',1535,2013,'Q2'),
 ('May',1565,2013,'Q2'),
 ('Aug',1246,2013,'Q3'),
 ('Jul',1200,2013,'Q3'),
 ('Sep',1090,2013,'Q3'),
 ('Dec',1520,2013,'Q4'),
 ('Nov',1500,2013,'Q4'),
 ('Oct',980,2013,'Q4'),
 ('Feb',1600,2014,'Q1'),
 ('Jan',1875,2014,'Q1'),
 ('Mar',1565,2014,'Q1'),
 ('Apr',2389,2014,'Q2'),
 ('Jun',1922,2014,'Q2'),
 ('May',1289,2014,'Q2'),
 ('Aug',1854,2014,'Q3'),
 ('Jul',2006,2014,'Q3'),
 ('Sep',1100,2014,'Q3'),
 ('Dec',2188,2014,'Q4'),
 ('Nov',1500,2014,'Q4'),
 ('Oct',875,2014,'Q4'),
 ('Feb',3965,2015,'Q1'),
 ('Jan',4087,2015,'Q1'),
 ('Mar',2684,2015,'Q1'),
 ('Apr',2983,2015,'Q2'),
 ('Jun',2315,2015,'Q2'),
 ('May',3265,2015,'Q2'),
 ('Aug',3998,2015,'Q3'),
 ('Jul',3215,2015,'Q3'),
 ('Sep',3787,2015,'Q3'),
 ('Dec',2148,2015,'Q4'),
 ('Nov',2654,2015,'Q4'),
 ('Oct',4098,2015,'Q4'),
 ('Feb',3965,2016,'Q1'),
 ('Jan',2983,2016,'Q1'),
 ('Mar',2952,2016,'Q1'),
 ('Apr',3998,2016,'Q2'),
 ('Jun',2737,2016,'Q2'),
 ('May',3265,2016,'Q2'),
 ('Aug',3787,2016,'Q3'),
 ('Jul',3215,2016,'Q3'),
 ('Sep',4171,2016,'Q3'),
 ('Dec',1256,2016,'Q4'),
 ('Nov',3566,2016,'Q4'),
 ('Oct',4078,2016,'Q4');
/*!40000 ALTER TABLE `monthly_sales` ENABLE KEYS */;
--
-- Dumping data for table `quarterly_sales`
--

/*!40000 ALTER TABLE `quarterly_sales` DISABLE KEYS */;
INSERT INTO `quarterly_sales` (`Quarter`,`Sales`,`Year`) VALUES
 ('Q1','7500','2011'),
 ('Q2','8150','2011'),
 ('Q3','9350','2011'),
 ('Q4','7145','2011'),
 ('Q1','7000','2012'),
 ('Q2','6178','2012'),
 ('Q3','8000','2012'),
 ('Q4','8900','2012'),
 ('Q1','3000','2013'),
 ('Q2','4000','2013'),
 ('Q2','3536','2013'),
 ('Q4','4000','2013'),
 ('Q1','5040','2014'),
 ('Q2','5600','2014'),
 ('Q3','4960','2014'),
 ('Q4','4563','2014'),
 ('Q1','10700','2015'),
 ('Q2','8563','2015'),
 ('Q3','11000','2015'),
 ('Q4','8900','2015'),
 ('Q1','9900','2016'),
 ('Q2','10000','2016'),
 ('Q3','11173','2016'),
 ('Q4','8900','2016');
/*!40000 ALTER TABLE `quarterly_sales` ENABLE KEYS */;
--
-- Dumping data for table `yearly_sales`
--

/*!40000 ALTER TABLE `yearly_sales` DISABLE KEYS */;
INSERT INTO `yearly_sales` (`Year`,`Sales`) VALUES
 ('2011','32145'),
 ('2012','30078'),
 ('2013','14536'),
 ('2014','20163'),
 ('2015','39163'),
 ('2016','39973');
/*!40000 ALTER TABLE `yearly_sales` ENABLE KEYS */;
We can verify whether the data is inserted by running the SELECT SQL command as shown below:
mysql> select * from yearly_sales;
+------+-------+
| Year | Sales |
+------+-------+
| 2011 | 32145 |
| 2012 | 30078 |
| 2013 | 14536 |
| 2014 | 20163 |
| 2015 | 39163 |
| 2016 | 39973 |
+------+-------+
6 rows in set (0.00 sec)
Similarly, we can check out if all the tables have the data properly inserted by running a select command for each table. If all of these properly return data like above, we’re all set to go to the second step.
Step-2: Implementing PHP based server program
Let us first list out the steps involved in the program before we proceed with its implementation.
-
Include the FusionCharts PHP wrapper.
-
Establish the connection with the MySQL database using the hostname, username, password and database name.
-
Include the FusionCharts library and the theme file.
-
Execute the query to retrieve Year on Year, Quarter on Quarter and Month on Month sales data from DB and create a data array in the data structure required for linked chart.
-
Encode the array into JSON. (If JSON is something new for you, then we would recommend you to read about it here.)
-
Feed the JSON data created to the FusionCharts constructor and supply the other required parameters.
-
Render the linked chart.
The implementation of the above steps is shown below:
- Download the FusionCharts PHP wrapper from here. Extract the downloaded zip, create a folder called fusioncharts in your project directory and copy the fusioncharts.php in the created fusioncharts folder. After copying include this file in your code as shown below
- The default username to connect to the MySQL instance running on your machine is ‘root’ and the password is what you configured during the installation of the stack. The interaction with the database from PHP is achieved using the mysqli extension. Given below is the code to establish the connection:
$hostdb = "MYSQL_SERVER_HOST_NAME"; // MySQl host
$userdb = "MYSQL_SERVER_USERNAME"; // MySQL username
$passdb = "MYSQL_SERVER_PASSWORD"; // MySQL password
$namedb = "MYSQL_SERVER_DATABASE_NAME"; // MySQL database name
//Establish connection with the database
$dbhandle = new mysqli($hostdb, $userdb, $passdb, $namedb);
//Validating DB Connection
if ($dbhandle->connect_error) {
exit("There was an error with your connection: " . $dbhandle->connect_error);
}- We would only need to include
fusioncharts.jsfor this sample and for theme we are using custom madeelegant.jsspecifically for this sample.
You can download an unlimited trial of FusionCharts consisting required core files here. The elegant.js can be found in the downloadable zip of this sample. You can learn how to create custom theme in the dev center.
Assuming you have the FusionCharts library placed inside the folder “fusioncharts/js” in your project after downloading the core FusionCharts library, include the file in a script tag and the required theme in the head section of the PHP file as below.
<head>
<title>Creating Drill Down Charts Using PHP and MySQL</title>
<!-- FusionCharts Core Package File -->
<script src="fusioncharts/js/fusioncharts.js"></script>
<script type="text/javascript" src="fusioncharts/js/elegant.js"></script>
<link href='https://fonts.googleapis.com/css?family=Open+Sans:300' rel='stylesheet' type='text/css'>
</head>- Now that a connection to the database server is established and all the required files are included, we will query the database and fetch the yearly sales data.
//SQL Query for the Parent chart.
$strQuery = "SELECT Year, Sales FROM yearly_sales";
//Execute the query, or else return the error message.
$result = $dbhandle->query($strQuery) or exit("Error code ({$dbhandle->errno}): {$dbhandle->error}");If the query returns a valid response we’ll start preparing the JSON array.
Before we dive into the code, let’s see what the JSON data for a multi-level drill-down should look like. There are a couple of important aspects of the data structure of linked charts that should be paid attention to. These are:
-
The
linkattribute: It defines the unique id of the linked data inside thelinkeddataarray. Using this attribute FusionCharts finds out the corresponding data for each linked item. -
linkeddataarray: It contains data for individual linked items.
The links should be defined in the format newchart-dataformat-datasource. For the data string method, dataformat takes JSON and datasource takes the value of the unique identifier that refers to the data embedded inside the linkeddata array in the parent data source. So the yearly drill-down links will get generated as newchart-json-2011, newchart-json-2012 ... newchart-json-2016
We’ll start with the data for the year 2011. In the code below, you can see that there are two levels of linked data, one for the yearly data and another for the quarterly data. The corresponding linked charts are defined inside the linkeddata arrays.
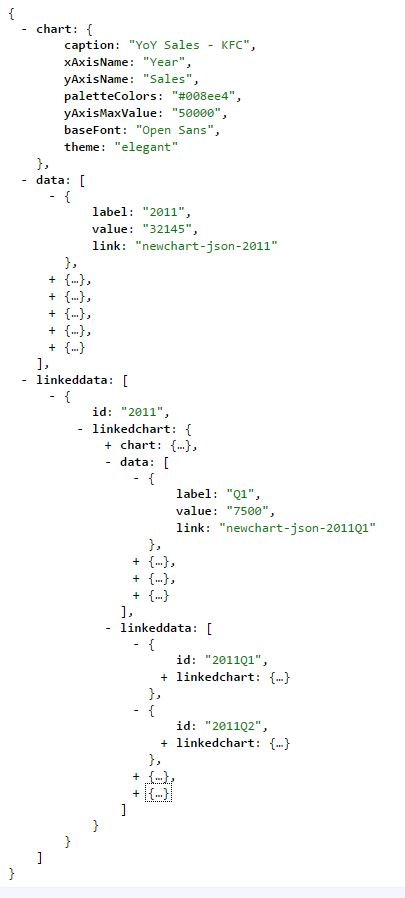
The final JSON code that we need for this sample should be as shown below:
{
"chart":{
"caption":"YoY Sales - KFC",
"xAxisName":"Year",
"yAxisName":"Sales",
"paletteColors":"#008ee4",
"yAxisMaxValue":"50000",
"baseFont":"Open Sans",
"theme":"elegant"
},
"data":[
{
"label":"2011",
"value":"32145",
"link":"newchart-json-2011"
},
{
"label":"2012",
"value":"30078",
"link":"newchart-json-2012"
},
{
"label":"2013",
"value":"14536",
"link":"newchart-json-2013"
},
{
"label":"2014",
"value":"20163",
"link":"newchart-json-2014"
},
{
"label":"2015",
"value":"39163",
"link":"newchart-json-2015"
},
{
"label":"2016",
"value":"39973",
"link":"newchart-json-2016"
}
],
"linkeddata":[
{
"id":"2011",
"linkedchart":{
"chart":{
"caption":"QoQ Sales - KFC for 2011",
"xAxisName":"Quarter",
"yAxisName":"Sales",
"paletteColors":"#6baa01",
"baseFont":"Open Sans",
"theme":"elegant"
},
"data":[
{
"label":"Q1",
"value":"7500",
"link":"newchart-json-2011Q1"
},
{
"label":"Q2",
"value":"8150",
"link":"newchart-json-2011Q2"
},
{
"label":"Q3",
"value":"9350",
"link":"newchart-json-2011Q3"
},
{
"label":"Q4",
"value":"7145",
"link":"newchart-json-2011Q4"
}
],
"linkeddata":[
{
"id":"2011Q1",
"linkedchart":{
"chart":{
"caption":"MoM Sales - KFC for Quarter Q1 of 2011",
"xAxisName":"Month",
"yAxisName":"Sales",
"paletteColors":"#f5555C",
"baseFont":"Open Sans",
"theme":"elegant"
},
"data":[
{
"label":"Jan",
"value":"2000"
},
{
"label":"Feb",
"value":"2300"
},
{
"label":"Mar",
"value":"3200"
}
]
}
},
{
"id":"2011Q2",
"linkedchart":{
"chart":{
"caption":"MoM Sales - KFC for Quarter Q2 of 2011",
"xAxisName":"Month",
"yAxisName":"Sales",
"paletteColors":"#f5555C",
"baseFont":"Open Sans",
"theme":"elegant"
},
"data":[
{
"label":"Apr",
"value":"2800"
},
{
"label":"May",
"value":"3000"
},
{
"label":"Jun",
"value":"2350"
}
]
}
},
{
"id":"2011Q3",
"linkedchart":{
"chart":{
"caption":"MoM Sales - KFC for Quarter Q3 of 2011",
"xAxisName":"Month",
"yAxisName":"Sales",
"paletteColors":"#f5555C",
"baseFont":"Open Sans",
"theme":"elegant"
},
"data":[
{
"label":"Jul",
"value":"2850"
},
{
"label":"Aug",
"value":"3000"
},
{
"label":"Sep",
"value":"3500"
}
]
}
},
{
"id":"2011Q4",
"linkedchart":{
"chart":{
"caption":"MoM Sales - KFC for Quarter Q4 of 2011",
"xAxisName":"Month",
"yAxisName":"Sales",
"paletteColors":"#f5555C",
"baseFont":"Open Sans",
"theme":"elegant"
},
"data":[
{
"label":"Oct",
"value":"3000"
},
{
"label":"Nov",
"value":"2895"
},
{
"label":"Dec",
"value":"1250"
}
]
}
}
]
}
},
{
"id":"2012",
"linkedchart":{
"chart":{
"caption":"QoQ Sales - KFC for 2012",
"xAxisName":"Quarter",
"yAxisName":"Sales",
"paletteColors":"#6baa01",
"baseFont":"Open Sans",
"theme":"elegant"
},
"data":[
{
"label":"Q1",
"value":"7000",
"link":"newchart-json-2012Q1"
},
{
"label":"Q2",
"value":"6178",
"link":"newchart-json-2012Q2"
},
{
"label":"Q3",
"value":"8000",
"link":"newchart-json-2012Q3"
},
{
"label":"Q4",
"value":"8900",
"link":"newchart-json-2012Q4"
}
],
"linkeddata":[
{
"id":"2012Q1",
"linkedchart":{
"chart":{
"caption":"MoM Sales - KFC for Quarter Q1 of 2012",
"xAxisName":"Month",
"yAxisName":"Sales",
"paletteColors":"#f5555C",
"baseFont":"Open Sans",
"theme":"elegant"
},
"data":[
{
"label":"Jan",
"value":"1585"
},
{
"label":"Feb",
"value":"2345"
},
{
"label":"Mar",
"value":"3070"
}
]
}
},
{
"id":"2012Q2",
"linkedchart":{
"chart":{
"caption":"MoM Sales - KFC for Quarter Q2 of 2012",
"xAxisName":"Month",
"yAxisName":"Sales",
"paletteColors":"#f5555C",
"baseFont":"Open Sans",
"theme":"elegant"
},
"data":[
{
"label":"Apr",
"value":"2856"
},
{
"label":"May",
"value":"2500"
},
{
"label":"Jun",
"value":"822"
}
]
}
},
{
"id":"2012Q3",
"linkedchart":{
"chart":{
"caption":"MoM Sales - KFC for Quarter Q3 of 2012",
"xAxisName":"Month",
"yAxisName":"Sales",
"paletteColors":"#f5555C",
"baseFont":"Open Sans",
"theme":"elegant"
},
"data":[
{
"label":"Jul",
"value":"1500"
},
{
"label":"Aug",
"value":"3296"
},
{
"label":"Sep",
"value":"3204"
}
]
}
},
{
"id":"2012Q4",
"linkedchart":{
"chart":{
"caption":"MoM Sales - KFC for Quarter Q4 of 2012",
"xAxisName":"Month",
"yAxisName":"Sales",
"paletteColors":"#f5555C",
"baseFont":"Open Sans",
"theme":"elegant"
},
"data":[
{
"label":"Oct",
"value":"3689"
},
{
"label":"Nov",
"value":"3200"
},
{
"label":"Dec",
"value":"2011"
}
]
}
}
]
}
},
{
"id":"2013",
"linkedchart":{
"chart":{
"caption":"QoQ Sales - KFC for 2013",
"xAxisName":"Quarter",
"yAxisName":"Sales",
"paletteColors":"#6baa01",
"baseFont":"Open Sans",
"theme":"elegant"
},
"data":[
{
"label":"Q1",
"value":"3000",
"link":"newchart-json-2013Q1"
},
{
"label":"Q2",
"value":"4000",
"link":"newchart-json-2013Q2"
},
{
"label":"Q2",
"value":"3536",
"link":"newchart-json-2013Q2"
},
{
"label":"Q4",
"value":"4000",
"link":"newchart-json-2013Q4"
}
],
"linkeddata":[
{
"id":"2013Q1",
"linkedchart":{
"chart":{
"caption":"MoM Sales - KFC for Quarter Q1 of 2013",
"xAxisName":"Month",
"yAxisName":"Sales",
"paletteColors":"#f5555C",
"baseFont":"Open Sans",
"theme":"elegant"
},
"data":[
{
"label":"Jan",
"value":"1200"
},
{
"label":"Feb",
"value":"500"
},
{
"label":"Mar",
"value":"400"
}
]
}
},
{
"id":"2013Q2",
"linkedchart":{
"chart":{
"caption":"MoM Sales - KFC for Quarter Q2 of 2013",
"xAxisName":"Month",
"yAxisName":"Sales",
"paletteColors":"#f5555C",
"baseFont":"Open Sans",
"theme":"elegant"
},
"data":[
{
"label":"Apr",
"value":"900"
},
{
"label":"May",
"value":"1565"
},
{
"label":"Jun",
"value":"1535"
}
]
}
},
{
"id":"2013Q4",
"linkedchart":{
"chart":{
"caption":"MoM Sales - KFC for Quarter Q4 of 2013",
"xAxisName":"Month",
"yAxisName":"Sales",
"paletteColors":"#f5555C",
"baseFont":"Open Sans",
"theme":"elegant"
},
"data":[
{
"label":"Oct",
"value":"980"
},
{
"label":"Nov",
"value":"1500"
},
{
"label":"Dec",
"value":"1520"
}
]
}
}
]
}
},
{
"id":"2014",
"linkedchart":{
"chart":{
"caption":"QoQ Sales - KFC for 2014",
"xAxisName":"Quarter",
"yAxisName":"Sales",
"paletteColors":"#6baa01",
"baseFont":"Open Sans",
"theme":"elegant"
},
"data":[
{
"label":"Q1",
"value":"5040",
"link":"newchart-json-2014Q1"
},
{
"label":"Q2",
"value":"5600",
"link":"newchart-json-2014Q2"
},
{
"label":"Q3",
"value":"4960",
"link":"newchart-json-2014Q3"
},
{
"label":"Q4",
"value":"4563",
"link":"newchart-json-2014Q4"
}
],
"linkeddata":[
{
"id":"2014Q1",
"linkedchart":{
"chart":{
"caption":"MoM Sales - KFC for Quarter Q1 of 2014",
"xAxisName":"Month",
"yAxisName":"Sales",
"paletteColors":"#f5555C",
"baseFont":"Open Sans",
"theme":"elegant"
},
"data":[
{
"label":"Jan",
"value":"1875"
},
{
"label":"Feb",
"value":"1600"
},
{
"label":"Mar",
"value":"1565"
}
]
}
},
{
"id":"2014Q2",
"linkedchart":{
"chart":{
"caption":"MoM Sales - KFC for Quarter Q2 of 2014",
"xAxisName":"Month",
"yAxisName":"Sales",
"paletteColors":"#f5555C",
"baseFont":"Open Sans",
"theme":"elegant"
},
"data":[
{
"label":"Apr",
"value":"2389"
},
{
"label":"May",
"value":"1289"
},
{
"label":"Jun",
"value":"1922"
}
]
}
},
{
"id":"2014Q3",
"linkedchart":{
"chart":{
"caption":"MoM Sales - KFC for Quarter Q3 of 2014",
"xAxisName":"Month",
"yAxisName":"Sales",
"paletteColors":"#f5555C",
"baseFont":"Open Sans",
"theme":"elegant"
},
"data":[
{
"label":"Jul",
"value":"2006"
},
{
"label":"Aug",
"value":"1854"
},
{
"label":"Sep",
"value":"1100"
}
]
}
},
{
"id":"2014Q4",
"linkedchart":{
"chart":{
"caption":"MoM Sales - KFC for Quarter Q4 of 2014",
"xAxisName":"Month",
"yAxisName":"Sales",
"paletteColors":"#f5555C",
"baseFont":"Open Sans",
"theme":"elegant"
},
"data":[
{
"label":"Oct",
"value":"875"
},
{
"label":"Nov",
"value":"1500"
},
{
"label":"Dec",
"value":"2188"
}
]
}
}
]
}
},
{
"id":"2015",
"linkedchart":{
"chart":{
"caption":"QoQ Sales - KFC for 2015",
"xAxisName":"Quarter",
"yAxisName":"Sales",
"paletteColors":"#6baa01",
"baseFont":"Open Sans",
"theme":"elegant"
},
"data":[
{
"label":"Q1",
"value":"10700",
"link":"newchart-json-2015Q1"
},
{
"label":"Q2",
"value":"8563",
"link":"newchart-json-2015Q2"
},
{
"label":"Q3",
"value":"11000",
"link":"newchart-json-2015Q3"
},
{
"label":"Q4",
"value":"8900",
"link":"newchart-json-2015Q4"
}
],
"linkeddata":[
{
"id":"2015Q1",
"linkedchart":{
"chart":{
"caption":"MoM Sales - KFC for Quarter Q1 of 2015",
"xAxisName":"Month",
"yAxisName":"Sales",
"paletteColors":"#f5555C",
"baseFont":"Open Sans",
"theme":"elegant"
},
"data":[
{
"label":"Jan",
"value":"4087"
},
{
"label":"Feb",
"value":"3965"
},
{
"label":"Mar",
"value":"2684"
}
]
}
},
{
"id":"2015Q2",
"linkedchart":{
"chart":{
"caption":"MoM Sales - KFC for Quarter Q2 of 2015",
"xAxisName":"Month",
"yAxisName":"Sales",
"paletteColors":"#f5555C",
"baseFont":"Open Sans",
"theme":"elegant"
},
"data":[
{
"label":"Apr",
"value":"2983"
},
{
"label":"May",
"value":"3265"
},
{
"label":"Jun",
"value":"2315"
}
]
}
},
{
"id":"2015Q3",
"linkedchart":{
"chart":{
"caption":"MoM Sales - KFC for Quarter Q3 of 2015",
"xAxisName":"Month",
"yAxisName":"Sales",
"paletteColors":"#f5555C",
"baseFont":"Open Sans",
"theme":"elegant"
},
"data":[
{
"label":"Jul",
"value":"3215"
},
{
"label":"Aug",
"value":"3998"
},
{
"label":"Sep",
"value":"3787"
}
]
}
},
{
"id":"2015Q4",
"linkedchart":{
"chart":{
"caption":"MoM Sales - KFC for Quarter Q4 of 2015",
"xAxisName":"Month",
"yAxisName":"Sales",
"paletteColors":"#f5555C",
"baseFont":"Open Sans",
"theme":"elegant"
},
"data":[
{
"label":"Oct",
"value":"4098"
},
{
"label":"Nov",
"value":"2654"
},
{
"label":"Dec",
"value":"2148"
}
]
}
}
]
}
},
{
"id":"2016",
"linkedchart":{
"chart":{
"caption":"QoQ Sales - KFC for 2016",
"xAxisName":"Quarter",
"yAxisName":"Sales",
"paletteColors":"#6baa01",
"baseFont":"Open Sans",
"theme":"elegant"
},
"data":[
{
"label":"Q1",
"value":"9900",
"link":"newchart-json-2016Q1"
},
{
"label":"Q2",
"value":"10000",
"link":"newchart-json-2016Q2"
},
{
"label":"Q3",
"value":"11173",
"link":"newchart-json-2016Q3"
},
{
"label":"Q4",
"value":"8900",
"link":"newchart-json-2016Q4"
}
],
"linkeddata":[
{
"id":"2016Q1",
"linkedchart":{
"chart":{
"caption":"MoM Sales - KFC for Quarter Q1 of 2016",
"xAxisName":"Month",
"yAxisName":"Sales",
"paletteColors":"#f5555C",
"baseFont":"Open Sans",
"theme":"elegant"
},
"data":[
{
"label":"Jan",
"value":"2983"
},
{
"label":"Feb",
"value":"3965"
},
{
"label":"Mar",
"value":"2952"
}
]
}
},
{
"id":"2016Q2",
"linkedchart":{
"chart":{
"caption":"MoM Sales - KFC for Quarter Q2 of 2016",
"xAxisName":"Month",
"yAxisName":"Sales",
"paletteColors":"#f5555C",
"baseFont":"Open Sans",
"theme":"elegant"
},
"data":[
{
"label":"Apr",
"value":"3998"
},
{
"label":"May",
"value":"3265"
},
{
"label":"Jun",
"value":"2737"
}
]
}
},
{
"id":"2016Q3",
"linkedchart":{
"chart":{
"caption":"MoM Sales - KFC for Quarter Q3 of 2016",
"xAxisName":"Month",
"yAxisName":"Sales",
"paletteColors":"#f5555C",
"baseFont":"Open Sans",
"theme":"elegant"
},
"data":[
{
"label":"Jul",
"value":"3215"
},
{
"label":"Aug",
"value":"3787"
},
{
"label":"Sep",
"value":"4171"
}
]
}
},
{
"id":"2016Q4",
"linkedchart":{
"chart":{
"caption":"MoM Sales - KFC for Quarter Q4 of 2016",
"xAxisName":"Month",
"yAxisName":"Sales",
"paletteColors":"#f5555C",
"baseFont":"Open Sans",
"theme":"elegant"
},
"data":[
{
"label":"Oct",
"value":"4078"
},
{
"label":"Nov",
"value":"3566"
},
{
"label":"Dec",
"value":"1256"
}
]
}
}
]
}
}
]
}Now let’s move on to the PHP code that will generate the above JSON data.
//SQL Query for the Parent chart.
$strQuery = "SELECT Year, Sales FROM yearly_sales";
//Execute the query, or else return the error message.
$result = $dbhandle->query($strQuery) or exit("Error code ({$dbhandle->errno}): {$dbhandle->error}");
//If the query returns a valid response, preparing the JSON array.
if ($result) {
//`$arrData` holds the Chart Options and Data.
$arrData = array(
"chart" => array(
"caption" => "YoY Sales - KFC",
"xAxisName"=> "Year",
"yAxisName"=> "Sales",
"paletteColors"=> "#008ee4",
"yAxisMaxValue"=> "50000",
"baseFont"=> "Open Sans",
"theme" => "elegant"
)
);
//Create an array for Parent Chart.
$arrData["data"] = array();
// Push data in array.
while ($row = mysqli_fetch_array($result)) {
array_push($arrData["data"], array(
"label" => $row["Year"],
"value" => $row["Sales"],
//Create link for yearly drilldown as "2011"
"link" => "newchart-json-" . $row["Year"]
));
}
//Data for Linked Chart will start from here, SQL query from quarterly_sales table
$year = 2011;
$strQuarterly = "SELECT Quarter, Sales, Year FROM quarterly_sales WHERE 1";
$resultQuarterly = $dbhandle->query($strQuarterly) or exit("Error code ({$dbhandle->errno}): {$dbhandle->error}");
//If the query returns a valid response, preparing the JSON array.
if ($resultQuarterly) {
$arrData["linkeddata"] = array(); //"linkeddata" is responsible for feeding data and chart options to child charts.
$arrDataMonth[2011]["linkeddata"] = array();
$arrDataMonth[2012]["linkeddata"] = array();
$arrDataMonth[2013]["linkeddata"] = array();
$arrDataMonth[2014]["linkeddata"] = array();
$arrDataMonth[2015]["linkeddata"] = array();
$arrDataMonth[2016]["linkeddata"] = array();
$i = 0;
if ($resultQuarterly) {
while ($row = mysqli_fetch_array($resultQuarterly)) {
//Collect the Year for which Quarterly drilldown will be created
$year = $row['Year'];
//Create the monthly drilldown data
$arrMonthHeader[$year][$row["Quarter"]] = array();
$arrMonthData[$year][$row["Quarter"]] = array();
// Retrieve monthly data based on year and quarter
$strMonthly = "SELECT * FROM monthly_sales WHERE `Year` = '".$year."' and `Quarter` = '".$row["Quarter"]."' Order by FIELD( `Month`, 'Jan', 'Feb', 'Mar', 'Apr', 'May', 'Jun', 'Jul', 'Aug', 'Sep', 'Oct', 'Nov', 'Dec' )" ;
$resultMonthly = $dbhandle->query($strMonthly) or exit("Error code ({$dbhandle->errno}): {$dbhandle->error}");
//Loop through monthly results
while ($rowMonthly = mysqli_fetch_assoc($resultMonthly)) {
//Create the monthly data for each quarter
if($rowMonthly['Quarter'] == $row["Quarter"])
{
array_push($arrMonthData[$year][$row["Quarter"]], array(
"label" => $rowMonthly["Month"],
"value" => $rowMonthly["Sales"]
));
}
}
//Create the data for monthly drilldown
$arrMonthHeader[$year][$row["Quarter"]] = array(
//Create the unique link id's provided from quarterly data as "2011Q1"
"id" => $year . $row['Quarter'],
//Create the data for the monthly charts for each quarter
"linkedchart" => array(
"chart" => array(
//Create dynamic caption based on the year and quarter
"caption" => "MoM Sales - KFC for Quarter ".$row["Quarter"]." of $year",
"xAxisName"=> "Month",
"yAxisName"=> "Sales",
"paletteColors"=> "#f5555C",
"baseFont"=> "Open Sans",
"theme" => "elegant"
),
"data" => $arrMonthData[$year][$row["Quarter"]]
)
);
//Finally push the data created into linkeddata node. Now our linked data for monthly drilldown for each quarter is ready
array_push($arrDataMonth[$year]["linkeddata"],$arrMonthHeader[$year][$row["Quarter"]]);
//Create the linkeddata for quarterly drilldown
//If the linnkeddata for a quarter of a year is ready and the year matches
if (isset($arrData["linkeddata"][$i-1]) && $arrData["linkeddata"][$i-1]["id"] == $year) {
if($row["Quarter"] == 'Q4'){
array_push($arrData["linkeddata"][$i-1]["linkedchart"]["data"], array(
"label" => $row["Quarter"],
"value" => $row["Sales"],
//Create the link for quarterly drilldown as "newchart-json-2011Q1"
"link" => "newchart-json-" . $year . $row["Quarter"]
));
//If we've reached the last quarter, append the data created for monthly drilldown
$arrData["linkeddata"][$i-1]["linkedchart"] = array_merge($arrData["linkeddata"][$i-1]["linkedchart"],$arrDataMonth[$year]);
}
else{
array_push($arrData["linkeddata"][$i-1]["linkedchart"]["data"], array(
"label" => $row["Quarter"],
"value" => $row["Sales"],
//Create the link for quarterly drilldown as "newchart-json-2011Q1"
"link" => "newchart-json-" . $year . $row["Quarter"]
));
}
}
//Inititate the linked data for quarterly drilldown
else {
array_push($arrData["linkeddata"], array(
"id" => "$year",
"linkedchart" => array(
"chart" => array(
//Create dynamic caption based on the year
"caption" => "QoQ Sales - KFC for $year",
"xAxisName"=> "Quarter",
"yAxisName"=> "Sales",
"paletteColors"=> "#6baa01",
"baseFont"=> "Open Sans",
"theme" => "elegant"
),
"data" => array(
array(
"label" => $row["Quarter"],
"value" => $row["Sales"],
//Create the link for quarterly drilldown as "newchart-json-2011Q1"
"link" => "newchart-json-" . $year . $row["Quarter"]
)
)
)
));
$i++;
}
}
}- Once we have the
$arrDataarray ready, we will convert/encode it to JSON data
//Convert the array created into JSON as our chart would recieve the dat ain JSON
$jsonEncodedData = json_encode($arrData);- Next, we’ll feed the JSON data created and the other required parameters to the FusionCharts constructor.
$columnChart = new FusionCharts("column2d", "myFirstChart" , "300%", "500", "linked-chart", "json", "$jsonEncodedData");- Finally, we will now call the render to render the linked chart now. For the
rendermethod to work, we will need a HTML div element (for our example, we will assign it the idlinked-chart). And we will also need to configure the link properties in a script tag, as shown below:
$columnChart->render(); //Render Method
<body>
<!-- DOM element for Chart -->
<?php echo "<script type=\"text/javascript\" >
FusionCharts.ready(function () {
FusionCharts('myFirstChart').configureLink({
overlayButton: {
message: 'Back',
padding: '13',
fontSize: '16',
fontColor: '#F7F3E7',
bold: '0',
bgColor: '#22252A',
borderColor: '#D5555C' } });
});
</script>"
?>
<div style="width:300px;" ><center><div id="linked-chart">Awesome Chart on its way!</div></center></div>
</body>Therefore, the complete code for this sample will be as shown below:
<?php
//including FusionCharts PHP Wrapper
include("fusioncharts/fusioncharts.php");
$hostdb = "localhost"; // MySQl host
$userdb = "root"; // MySQL username
$passdb = "root"; // MySQL password
$namedb = "drilldown"; // MySQL database name
//Establish connection with the database
$dbhandle = new mysqli($hostdb, $userdb, $passdb, $namedb);
//Validating DB Connection
if ($dbhandle->connect_error) {
exit("There was an error with your connection: " . $dbhandle->connect_error);
}
?>
<html>
<head>
  <title>Creating Drill Down Charts Using PHP and MySQL</title>
  <!-- FusionCharts Core Package File -->
  <script src="fusioncharts/js/fusioncharts.js"></script>
  <script type="text/javascript" src="fusioncharts/js/elegant.js"></script>
  <link href='https://fonts.googleapis.com/css?family=Open+Sans:300' rel='stylesheet' type='text/css'>
</head>
<?php
//SQL Query for the Parent chart.
$strQuery = "SELECT Year, Sales FROM yearly_sales";

//Execute the query, or else return the error message.
$result = $dbhandle->query($strQuery) or exit("Error code ({$dbhandle->errno}): {$dbhandle->error}");
//If the query returns a valid response, preparing the JSON array.
if ($result) {
//`$arrData` holds the Chart Options and Data.
$arrData = array(
"chart" => array(
"caption" => "YoY Sales - KFC",
"xAxisName"=> "Year",
"yAxisName"=> "Sales",
"paletteColors"=> "#008ee4",
"yAxisMaxValue"=> "50000",
"baseFont"=> "Open Sans",
"theme" => "elegant"
)
);
//Create an array for Parent Chart.
$arrData["data"] = array();
// Push data in array.
while ($row = mysqli_fetch_array($result)) {
array_push($arrData["data"], array(
"label" => $row["Year"],
"value" => $row["Sales"],
//Create link for yearly drilldown as "2011"
"link" => "newchart-json-" . $row["Year"]
));
}
//Data for Linked Chart will start from here, SQL query from quarterly_sales table
$year = 2011;
$strQuarterly = "SELECT Quarter, Sales, Year FROM quarterly_sales WHERE 1";
$resultQuarterly = $dbhandle->query($strQuarterly) or exit("Error code ({$dbhandle->errno}): {$dbhandle->error}");
//If the query returns a valid response, preparing the JSON array.
if ($resultQuarterly) {
$arrData["linkeddata"] = array(); //"linkeddata" is responsible for feeding data and chart options to child charts.
$arrDataMonth[2011]["linkeddata"] = array();
$arrDataMonth[2012]["linkeddata"] = array();
$arrDataMonth[2013]["linkeddata"] = array();
$arrDataMonth[2014]["linkeddata"] = array();
$arrDataMonth[2015]["linkeddata"] = array();
$arrDataMonth[2016]["linkeddata"] = array();
$i = 0;
if ($resultQuarterly) {
while ($row = mysqli_fetch_array($resultQuarterly)) {
//Collect the Year for which Quarterly drilldown will be created
$year = $row['Year'];
//Create the monthly drilldown data
$arrMonthHeader[$year][$row["Quarter"]] = array();
$arrMonthData[$year][$row["Quarter"]] = array();
// Retrieve monthly data based on year and quarter
$strMonthly = "SELECT * FROM monthly_sales WHERE `Year` = '".$year."' and `Quarter` = '".$row["Quarter"]."' Order by FIELD( `Month`, 'Jan', 'Feb', 'Mar', 'Apr', 'May', 'Jun', 'Jul', 'Aug', 'Sep', 'Oct', 'Nov', 'Dec' )" ;
$resultMonthly = $dbhandle->query($strMonthly) or exit("Error code ({$dbhandle->errno}): {$dbhandle->error}");
//Loop through monthly results
while ($rowMonthly = mysqli_fetch_assoc($resultMonthly)) {
//Create the monthly data for each quarter
if($rowMonthly['Quarter'] == $row["Quarter"])
{
array_push($arrMonthData[$year][$row["Quarter"]], array(
"label" => $rowMonthly["Month"],
"value" => $rowMonthly["Sales"]
));
}
}
//Create the data for monthly drilldown
$arrMonthHeader[$year][$row["Quarter"]] = array(
//Create the unique link id's provided from quarterly data as "2011Q1"
"id" => $year . $row['Quarter'],
//Create the data for the monthly charts for each quarter
"linkedchart" => array(
"chart" => array(
//Create dynamic caption based on the year and quarter
"caption" => "MoM Sales - KFC for Quarter ".$row["Quarter"]." of $year",
"xAxisName"=> "Month",
"yAxisName"=> "Sales",
"paletteColors"=> "#f5555C",
"baseFont"=> "Open Sans",
"theme" => "elegant"
),
"data" => $arrMonthData[$year][$row["Quarter"]]
)
);
//Finally push the data created into linkeddata node. Now our linked data for monthly drilldown for each quarter is ready
array_push($arrDataMonth[$year]["linkeddata"],$arrMonthHeader[$year][$row["Quarter"]]);
//Create the linkeddata for quarterly drilldown
//If the linnkeddata for a quarter of a year is ready and the year matches
if (isset($arrData["linkeddata"][$i-1]) && $arrData["linkeddata"][$i-1]["id"] == $year) {
if($row["Quarter"] == 'Q4'){
array_push($arrData["linkeddata"][$i-1]["linkedchart"]["data"], array(
"label" => $row["Quarter"],
"value" => $row["Sales"],
//Create the link for quarterly drilldown as "newchart-json-2011Q1"
"link" => "newchart-json-" . $year . $row["Quarter"]
));
//If we've reached the last quarter, append the data created for monthly drilldown
$arrData["linkeddata"][$i-1]["linkedchart"] = array_merge($arrData["linkeddata"][$i-1]["linkedchart"],$arrDataMonth[$year]);
}
else{
array_push($arrData["linkeddata"][$i-1]["linkedchart"]["data"], array(
"label" => $row["Quarter"],
"value" => $row["Sales"],
//Create the link for quarterly drilldown as "newchart-json-2011Q1"
"link" => "newchart-json-" . $year . $row["Quarter"]
));
}
}
//Inititate the linked data for quarterly drilldown
else {
array_push($arrData["linkeddata"], array(
"id" => "$year",
"linkedchart" => array(
"chart" => array(
//Create dynamic caption based on the year
"caption" => "QoQ Sales - KFC for $year",
"xAxisName"=> "Quarter",
"yAxisName"=> "Sales",
"paletteColors"=> "#6baa01",
"baseFont"=> "Open Sans",
"theme" => "elegant"
),
"data" => array(
array(
"label" => $row["Quarter"],
"value" => $row["Sales"],
//Create the link for quarterly drilldown as "newchart-json-2011Q1"
"link" => "newchart-json-" . $year . $row["Quarter"]
)
)
)
));
$i++;
}
}
}
//Convert the array created into JSON as our chart would recieve the dat ain JSON
$jsonEncodedData = json_encode($arrData);
$columnChart = new FusionCharts("column2d", "myFirstChart" , "300%", "500", "linked-chart", "json", "$jsonEncodedData");
$columnChart->render(); //Render Method
$dbhandle->close(); //Closing DB Connection
}
}
?>
<body>
<!-- DOM element for Chart -->
<?php echo "<script type=\"text/javascript\" >
FusionCharts.ready(function () {
FusionCharts('myFirstChart').configureLink({
overlayButton: {
message: 'Back',
padding: '13',
fontSize: '16',
fontColor: '#F7F3E7',
bold: '0',
bgColor: '#22252A',
borderColor: '#D5555C' } });
});
</script>"
?>
<div style="width:300px;" ><center><div id="linked-chart">Awesome Chart on its way!</div></center></div>
</body>
</html>The final chart, with two levels of drill-down, will look as shown below: