Loading
Setting Message Logger
FusionCharts Suite XT uses the concept of streaming and showing real-time messages on the chart using the message logger. The message logger can be effectively used to show necessary real-time information or live error bugs.
The message logger is essentially a scrollable text-based scrollable window that can listen to messages streamed the from server and then do one of the following:
-
Display the message in the message logger window
-
Pass it to custom JavaScript functions (defined by you) for further actions
A simple message logger looks as shown in the image below:
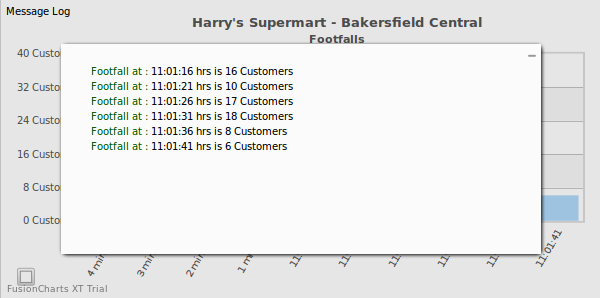
In the above image, we have a real-time column chart that monitors the footfalls at Bakersfield Central. Overlapping this chart is the message logger that contains messages that were streamed to the message logger by the server.
The FusionCharts Suite XT message logger has the following features:
-
Message logger is supported by all real-time charts and gauges. The non real-time charts do not support the message logger.
-
Each real time update of the chart can have one message to be added to the logger.
-
Because it is a scrollable, the message logger can contain any number of messages.
-
The cosmetics of this message logger are fully customizable.
-
Messages streamed to the message logger can either be displayed in the in-built logger or passed to any JavaScript function present in the same page. This helps you build your custom client-side loggers, without having to worry about retrieving real time data from the server.
-
The message logger be switched on or off by setting
useMessageLogto 0 or 1 in thechartobject of the JSON data (or in the<chart>element of the XML data) for the chart. -
Additionally, end users can also show/hide the logger at client-side by pressing Shift + M.
-
You can also use client-side JavaScript to show/hide the message logger for a chart.
-
Messages streamed to the logger can be of 4 types -
INFO,ERROR,LITERAL, orLINK. You can decide the type for each message that you send to the logger. Messages displayed in the logger are formatted based on their type. -
The logger can be cleared dynamically at run-time (to get rid of existing messages) either by sending a
&clearLog=1flag in the real-time data stream, or by using client-side JavaScript. -
The message logger window in JavaScript Real-time charts and gauges shows a close button that allows you to close the logger.
In this section, you will be shown how you can:
-
Send real-time updates that can be streamed to the message logger
-
Use the client-side JavaScript API to manipulate the message logger
Setting up the Message Logger
The following two steps are involved in configuring and using the message logger.
-
Configure your JSON data to to use the message logger by setting its functional and cosmetic properties.
-
Configure the real-time data provider page to broadcast/stream messages to the logger.
Configuring the Message Logger
The following code snippet enables the use of the message logger for a real-time chart:
Given below is a brief description of the attributes used in the code snippet above:
| Attribute Name | Description |
|---|---|
|
It is used to specify whether the message logger will be used for a real-time chart/gauge. Setting this attribute to The message logger, however, will become visible only when it listens to the first message streamed from the server. |
|
It is used to specify whether the real-time update-related menu items will be shown in the chart’s context menu. Setting this attribute to The context menu appears as a button in the bottom-left corner of the chart (you can refer to the image shown above). |
When the first message is streamed to the chart from server, the message logger is displayed as shown in the image below:

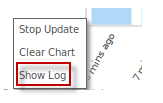
A close button appears at the top-right corner of the message logger window that you can use to close the message logger. Or you can click anywhere outside the message logger window. To re-open the message logger, click the Show Log option from the context menu, as shown in the image below:
Given below is a brief description of the attributes used to configure the functional and cosmetic properties of the message logger:
| Attribute Name | Description |
|---|---|
|
It is used to specify the width percent of the message logger window with respect to the width of the entire chart. So, if you set it to 80, the message logger window will take up 80% of chart width. |
|
It is used to specify the height percent of the message logger window with respect to the height of the entire chart. |
|
It is used to specify whether a title will be shown for the message logger. Setting this attribute to |
|
It is used to specify the title for the message logger, if you have set the |
|
It is used to specify the hex code of the color that will be applied to the entire message log window. |
|
The messages streamed to the chart can either be displayed in the message log window or can be passed to JavaScript functions(which we’ll see next). This attribute is used to specify whether the messages should be logged in the built-in log window. Setting this attribute to |
|
It is used to specify whether each message streamed from the server will be passed to a local JavaScript function. Setting this attribute to |
|
It is used to specify the name of the JavaScript function that will handle messages from the server. This helps you to create custom functions to react to the messages streamed. |
|
It is used to specify whether all parameters of a message envelope will be passed to the custom JavaScript function. Setting this attribute to |
The messageGoesToJS attribute is used to pass only the “Message Text” parameter to the JavaScript function, whereas, the messagePassAllToJS is used to pass all the four parameters to the JavaScript function.
Streaming Messages
Each real-time update of the chart can contain one message to be added to the message logger. The messages to be logged should be provided in the real-time data stream and not in the JSON/XML data. Real-time data stream refers to the data provided by the URL specified in the dataStreamURL attribute.
Given below is a brief description of the attributes to log messages provided in the real-time data stream:
| Attribute Name | Description |
|---|---|
|
It is used to specify a unique ID for each message, which is used to track messages in the custom JavaScript function and take the required actions. The ID is NOT displayed in the message logger window. |
|
It is used to specify the message title that can be displayed in the message logger window or passed to the JavaScript function. |
|
It is used to specify the message text. |
|
It is used to specify the message type. Possible values are |
|
The messages streamed to the chart can either be displayed in the message log window or can be passed to JavaScript functions(which we’ll see next). This attribute is used to specify whether the messages should be logged in the built-in log window. Setting this attribute to |
|
It is used to specify whether each message streamed from the server will be passed to a local JavaScript function. Setting this attribute to |
|
It is used to clear the message history for the chart currently rendered. To clear message history, set this attribute to |
In the next section, we will look at different examples of real-time updates that can be streamed to the message logger.
Examples of Real-time Update
Simple Example
An example of a real-time update string passed to the message logger (contained in the column chart shown above) is given below:
In this update, the &label and &value parameters are absorbed by the chart for data update.
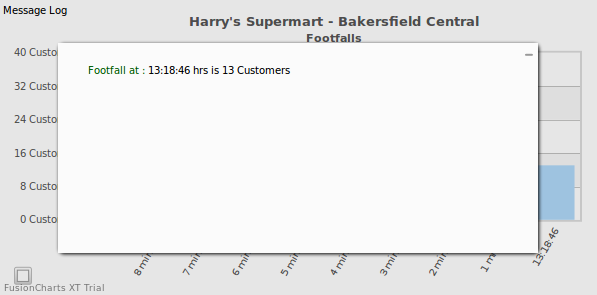
The &msgTitle and &msgText parameters are absorbed by the message logger. &msgTitle is set to “Footfall at : “ and &msgText is set to “13:18:46 hrs is 13 Customers”.
When a chart (with useMessageLog set to 1) accepts this data stream, the message logger, as shown in the image below, is displayed:
Note: If you are passing any special characters as part of your message text or title (like &, % etc.), you will need to URL Encode the text/title.
Changing the Message Type
A real-time chart that plots the footfalls at Bakersfield Central is shown below:
{
    "chart": {
        "caption": "Harry's Supermart - Bakersfield Central",
        "subCaption": "Footfalls",
        "showrealtimevalue": "1",
        "borderAlpha": "0",
        "yaxismaxvalue": "40",
        "numdisplaysets": "10",
        "usePlotGradientColor": "0",
        "canvasBorderAlpha": "20",
        "labeldisplay": "rotate",
        "slantLabels": "1",
        "showLegend": "0",
        "plotBorderAlpha": "0",
        "bgAlpha": "0",
        "showValues": "0",
        "numbersuffix": " Customers",
        "showlabels": "1",
        "animation": "0",
        "showRealTimeValue": "0",
        "useMessageLog": "1",
        "showRTmenuItem": "1"
    },
    "categories": [
        {
            "category": [
                {
                    "label": "8 mins ago"
                },
                {
                    "label": "7 mins ago"
                },
                {
                    "label": "6 mins ago"
                },
                {
                    "label": "5 mins ago"
                },
                {
                    "label": "4 mins ago"
                },
                {
                    "label": "3 mins ago"
                },
                {
                    "label": "2 mins ago"
                },
                {
                    "label": "1 min ago"
                }
            ]
        }
    ],
    "dataset": [
        {
            "seriesname": "Footfall",
            "alpha": "100",
            "anchoralpha": "60",
            "anchorRadius": "4",
            "anchorBgColor": "#",
            "linethickness": "2",
            "data": [
                {
                    "value": "5"
                },
                {
                    "value": "17"
                },
                {
                    "value": "10"
                },
                {
                    "value": "15"
                },
                {
                    "value": "5"
                },
                {
                    "value": "12"
                },
                {
                    "value": "8"
                },
                {
                    "value": "10"
                }
            ]
        }
    ],
    "alerts": {
        "alert": [
            {
                "minvalue": "15",
                "maxvalue": "20",
                "action": "callJS",
                "param": ""
            }
        ]
    }
}
<html>
<head>
<title>My first chart using FusionCharts Suite XT</title>
<script type="text/javascript" src="http://static.fusioncharts.com/code/latest/fusioncharts.js"></script>
<script type="text/javascript" src="http://static.fusioncharts.com/code/latest/themes/fusioncharts.theme.fint.js?cacheBust=56"></script>
<script type="text/javascript">
FusionCharts.ready(function(){
var fusioncharts = new FusionCharts({
id: "ootfallChart-1",
type: 'realtimecolumn',
renderAt: 'chart-container',
width: '600',
height: '300',
dataFormat: 'json',
dataSource: {
"chart": {
"caption": "Harry's Supermart - Bakersfield Central",
"subCaption": "Footfalls",
"showrealtimevalue": "1",
"borderAlpha": "0",
"yaxismaxvalue": "40",
"numdisplaysets": "10",
"usePlotGradientColor": "0",
"canvasBorderAlpha": "20",
"labeldisplay": "rotate",
"slantLabels": "1",
"showLegend": "0",
"plotBorderAlpha": "0",
"bgAlpha": "0",
"showValues": "0",
"numbersuffix": " Customers",
"showlabels": "1",
"animation": "0",
"showRealTimeValue": "0",
"useMessageLog": "1",
"showRTmenuItem": "1"
},
"categories": [{
"category": [{
"label": "8 mins ago"
}, {
"label": "7 mins ago"
}, {
"label": "6 mins ago"
}, {
"label": "5 mins ago"
}, {
"label": "4 mins ago"
}, {
"label": "3 mins ago"
}, {
"label": "2 mins ago"
}, {
"label": "1 min ago"
}]
}],
"dataset": [{
"seriesname": "Footfall",
"alpha": "100",
"anchoralpha": "60",
"anchorRadius": "4",
"anchorBgColor": "#",
"linethickness": "2",
"data": [{
"value": "5"
}, {
"value": "17"
}, {
"value": "10"
}, {
"value": "15"
}, {
"value": "5"
}, {
"value": "12"
}, {
"value": "8"
}, {
"value": "10"
}]
}],
"alerts": {
"alert": [{
"minvalue": "15",
"maxvalue": "20",
"action": "callJS",
"param": ""
}]
}
},
events: {
'rendered': function(evt, args) {
//Format minutes, seconds by adding 0 prefix accordingly
function formatTime(time) {
(time < 10) ? (time = "0" + time) : (time = time);
return time;
}
evt.sender.chartInterval = setInterval(function() {
//Get reference to the chart using its ID
var chartRef = evt.sender,
//We need to create a querystring format incremental update, containing
//label in hh:mm:ss format
//and a value (random).
currDate = new Date(),
label = formatTime(currDate.getHours()) + ":" + formatTime(currDate.getMinutes()) + ":" + formatTime(currDate.getSeconds()),
//Get random number between 5 & 20 - rounded
footfall = Math.round(Math.random() * 15) + 5,
//Error message added if the footfall is less than 7
strData = "&label=" + label + "&value=" + footfall + "&msgTitle=Footfall at &msgText=" + label + " hrs is " + footfall + " Customers" + ((footfall < 9) ? " WARNING !!!&msgType=ERROR" : "");
//Feed it to chart.
chartRef.feedData(strData);
}, 5000);
},
'disposed': function(evt, arg) {
clearInterval(evt.sender.chartInterval);
}
}
}
);
fusioncharts.render();
});
</script>
</head>
<body>
<div id="chart-container">FusionCharts XT will load here!</div>
</body>
</html>We have configured this chart to display an ERROR message in the message logger whenever the number of footfalls goes below 9. Open the message logger to look at the messages displayed for each real-time update.
To specify the message type, you can provide data in the following format:
&label=14%3A46%3A12&value=6&msgTitle=Footfall at : &msgText=14%3A46%3A12 hrs is 6 Customers WARNING !!!&msgType=ERRORCreating Messages with Links
To display messages of type LINK, you can provide the following data:
&msgTitle=Check Dashboards for details&msgText=http%3A%2F%2Fwww%2Efusioncharts%2Ecom%3Fid%3D34&msgType=LINKBecause we want to link the message to http://www.fusioncharts.com?id=34, the &msgText contains the URL Encoded link.
Clearing the Message Logger from the Server
You can send an instruction to the chart from the server to clear the contents of the visible message logger. To do this, you need to send the following command:
You can send it as a part of the message stream, as shown in the example below:
&label=14%3A46%3A12&value=6&msgTitle=Footfall at : &msgText=14%3A46%3A12 hrs is 6 Customers WARNING !!!&msgType=ERROR&clearLog=1This will clear all the contents of the existing message logger and start afresh.
If you send &clearLog=1 with each real-time update, the chart will not show any messages in the logger, because the log will be cleared with each update. Therefore, be careful to send this command only when the log needs to be cleared.
Additionally, you can also clear the message logger using client-side JavaScript API.
Handling Messages in JavaScript
You can pass the entire (or partial) message envelope to custom JavaScript functions present in the page that contains chart.
A real-time column chart configured to pass all parameters from the message envelope to your custom JavaScript function is shown below:
{
    "chart": {
        "caption": "Harry's Supermart - Bakersfield Central",
        "subCaption": "Footfalls",
        "showrealtimevalue": "1",
        "borderAlpha": "0",
        "yaxismaxvalue": "40",
        "numdisplaysets": "10",
        "usePlotGradientColor": "0",
        "canvasBorderAlpha": "20",
        "labeldisplay": "rotate",
        "slantLabels": "1",
        "showLegend": "0",
        "plotBorderAlpha": "0",
        "bgAlpha": "0",
        "showValues": "0",
        "numbersuffix": " Customers",
        "showlabels": "1",
        "animation": "0",
        "showRealTimeValue": "0",
        "useMessageLog": "1",
        "messageGoesToJS": "1",
        "messageJSHandler": "displayData",
        "messagePassAllToJS": "1"
    },
    "categories": [
        {
            "category": [
                {
                    "label": "8 mins ago"
                },
                {
                    "label": "7 mins ago"
                },
                {
                    "label": "6 mins ago"
                },
                {
                    "label": "5 mins ago"
                },
                {
                    "label": "4 mins ago"
                },
                {
                    "label": "3 mins ago"
                },
                {
                    "label": "2 mins ago"
                },
                {
                    "label": "1 min ago"
                }
            ]
        }
    ],
    "dataset": [
        {
            "seriesname": "Footfall",
            "alpha": "100",
            "anchoralpha": "60",
            "anchorRadius": "4",
            "anchorBgColor": "#",
            "linethickness": "2",
            "data": [
                {
                    "value": "5"
                },
                {
                    "value": "17"
                },
                {
                    "value": "10"
                },
                {
                    "value": "15"
                },
                {
                    "value": "5"
                },
                {
                    "value": "12"
                },
                {
                    "value": "8"
                },
                {
                    "value": "10"
                }
            ]
        }
    ],
    "alerts": {
        "alert": [
            {
                "minvalue": "15",
                "maxvalue": "20",
                "action": "callJS",
                "param": ""
            }
        ]
    }
}
<html>
<head>
<title>My first chart using FusionCharts Suite XT</title>
<script type="text/javascript" src="http://static.fusioncharts.com/code/latest/fusioncharts.js"></script>
<script type="text/javascript" src="http://static.fusioncharts.com/code/latest/themes/fusioncharts.theme.fint.js?cacheBust=56"></script>
<script type="text/javascript">
FusionCharts.ready(function(){
var fusioncharts = new FusionCharts({
id: "footfallChart-2",
type: 'realtimecolumn',
renderAt: 'chart-container',
width: '600',
height: '300',
dataFormat: 'json',
dataSource: {
"chart": {
"caption": "Harry's Supermart - Bakersfield Central",
"subCaption": "Footfalls",
"showrealtimevalue": "1",
"borderAlpha": "0",
"yaxismaxvalue": "40",
"numdisplaysets": "10",
"usePlotGradientColor": "0",
"canvasBorderAlpha": "20",
"labeldisplay": "rotate",
"slantLabels": "1",
"showLegend": "0",
"plotBorderAlpha": "0",
"bgAlpha": "0",
"showValues": "0",
"numbersuffix": " Customers",
"showlabels": "1",
"animation": "0",
"showRealTimeValue": "0",
"useMessageLog": "1",
"messageGoesToJS": "1",
"messageJSHandler": "displayData",
"messagePassAllToJS": "1",
},
"categories": [{
"category": [{
"label": "8 mins ago"
}, {
"label": "7 mins ago"
}, {
"label": "6 mins ago"
}, {
"label": "5 mins ago"
}, {
"label": "4 mins ago"
}, {
"label": "3 mins ago"
}, {
"label": "2 mins ago"
}, {
"label": "1 min ago"
}]
}],
"dataset": [{
"seriesname": "Footfall",
"alpha": "100",
"anchoralpha": "60",
"anchorRadius": "4",
"anchorBgColor": "#",
"linethickness": "2",
"data": [{
"value": "5"
}, {
"value": "17"
}, {
"value": "10"
}, {
"value": "15"
}, {
"value": "5"
}, {
"value": "12"
}, {
"value": "8"
}, {
"value": "10"
}]
}],
"alerts": {
"alert": [{
"minvalue": "15",
"maxvalue": "20",
"action": "callJS",
"param": ""
}]
}
},
events: {
'beforerender': function(evt, args) {
var controllers = document.createElement('div');
controllers.setAttribute('id', 'tableView');
// Create div
controllers.innerHTML = '<div id="details" style=" width:260px;height:80px;border: 2px solid #ddd;margin-left: 160px"> <div style ="font-family:Arial;font-size: 15px;text-align:center;font-weight: bold;height:25px;border-bottom: 2px solid #ddd">Current Status</div><div id="data" style="font-family:Arial;font-size: 15px;text-align:center;font-weight: bold;padding-top:10px;color: #008ee4"></div></div>';
//Display container div and write table
args.container.parentNode.insertBefore(controllers, args.container.nextSibling);
},
'rendered': function(evt, args) {
//JS Message handler function, displaying the current data in a div
displayData = function(strMsgId, strMsgTitle, strMsgText, strMsgType) {
var div = document.getElementById('data');
div.innerHTML = strMsgTitle + strMsgText;
}
//Format minutes, seconds by adding 0 prefix accordingly
function formatTime(time) {
(time < 10) ? (time = "0" + time) : (time = time);
return time;
}
evt.sender.chartInterval = setInterval(function() {
var currDate,
label,
footfall,
strData,
//Get reference to the chart using its ID
chartRef = evt.sender;
//We need to create a querystring format incremental update, containing
//label in hh:mm:ss format
//and a value (random).
currDate = new Date();
label = formatTime(currDate.getHours()) + ":" + formatTime(currDate.getMinutes()) + ":" + formatTime(currDate.getSeconds());
//Get random number between 5 & 20 - rounded
footfall = Math.round(Math.random() * 15) + 5;
strData = "&label=" + label + "&value=" + footfall + "&msgTitle=Footfall at " + label + "&msgText= is " + footfall + " Customers ";
//Feed it to chart.
chartRef.feedData(strData);
}, 5000);
},
'disposed': function(evt, arg) {
clearInterval(evt.sender.chartInterval);
}
}
}
);
fusioncharts.render();
});
</script>
</head>
<body>
<div id="chart-container">FusionCharts XT will load here!</div>
</body>
</html>The useMessageLog, messageGoesToJS, messageJSHandler, and messagePassAllToJS attributes (described earlier in this article) are used to pass all parameters from the message envelope to your function.
Using the Client-side JavaScript API
Using the client-side JavaScript API, you can manipulate the message logger to show/hide the logger or clear the message history.
To do any of these actions, you will need to get a reference to the chart. To get the reference to a chart, you can use the DOMID of the chart and pass it using any of the following ways:
or
The legacy function getChartFromId() still works as show below:
However, note that getChartFromId() has been deprecated.
You can call the JavaScript APIs of a chart only after it has rendered. You can use the rendered event listener to check if a chart has rendered.
Once you have obtained the reference to the chart, you can use any of the functions below on the chart’s logger:
| Function | Description |
|---|---|
|
It is used to show the message logger, if it is not already visible. |
|
It is used to hide the message logger, if it is already visible. |
|
It is used to clear the contents of the message logger. |
If you get JavaScript errors when accessing the above functions, make sure that:
-
you have enabled the message logger for the chart as mentioned in
Setting up the Message LoggerandConfiguring the Message Loggersection above. -
you are accessing these functions after the chart has rendered (you can use the rendered event listener to track if a chart has finished rendering).