Loading
Multiple Datasets and Updates
Real-time charts in the FusionCharts Suite XT can be plotted for any number of datasets. This feature, however, is configured differently from adding and updating a single dataset.
In this section, you will be shown how you can:
Adding Multiple Datasets
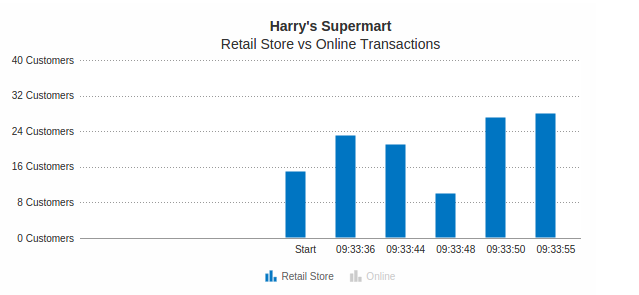
A real-time column chart that compares the retail and online store transactions at Harry’s SuperMart looks like this:
{
    "chart": {
        "caption": "Harry's Supermart",
        "subCaption": "Retail Store vs Online Transactions",
        "dataStreamURL": "../../../resources/php/advance-charting-real-time-charts-multiple-datasets-and-updates-php-1.php",
        "refreshInterval": "5",
        "yaxismaxvalue": "40",
        "numdisplaysets": "10",
        "numbersuffix": " Customers",
        "showlabels": "1",
        "showValues": "0",
        "showRealTimeValue": "0",
        "theme": "fint"
    },
    "categories": [
        {
            "category": [
                {
                    "label": "Start"
                }
            ]
        }
    ],
    "dataset": [
        {
            "seriesname": "Retail Store",
            "alpha": "100",
            "data": [
                {
                    "value": "15"
                }
            ]
        },
        {
            "seriesname": "Online",
            "alpha": "100",
            "data": [
                {
                    "value": "2"
                }
            ]
        }
    ]
}
<html>
<head>
<title>My first chart using FusionCharts Suite XT</title>
<script type="text/javascript" src="http://static.fusioncharts.com/code/latest/fusioncharts.js"></script>
<script type="text/javascript" src="http://static.fusioncharts.com/code/latest/themes/fusioncharts.theme.fint.js?cacheBust=56"></script>
<script type="text/javascript">
FusionCharts.ready(function(){
var fusioncharts = new FusionCharts({
id: "mychart",
type: 'realtimecolumn',
renderAt: 'chart-container',
width: '600',
height: '300',
dataFormat: 'json',
dataSource: {
"chart": {
"caption": "Harry's Supermart",
"subCaption": "Retail Store vs Online Transactions",
"dataStreamURL": "../../../resources/php/advance-charting-real-time-charts-multiple-datasets-and-updates-php-1.php",
"refreshInterval": "5",
"yaxismaxvalue": "40",
"numdisplaysets": "10",
"numbersuffix": " Customers",
"showlabels": "1",
"showValues": "0",
"showRealTimeValue": "0",
"theme": "fint"
},
"categories": [{
"category": [{
"label": "Start"
}]
}],
"dataset": [{
"seriesname": "Retail Store",
"alpha": "100",
"data": [{
"value": "15"
}]
}, {
"seriesname": "Online",
"alpha": "100",
"data": [{
"value": "2"
}]
}]
}
}
);
fusioncharts.render();
});
</script>
</head>
<body>
<div id="chart-container">FusionCharts XT will load here!</div>
</body>
</html>As seen, the above chart is plotted for two datasets - retail store transactions and online transactions.
In the above data, the dataStreamURL attribute is used to set advance-charting-real-time-charts-multiple-datasets-and-updates-php-1.php as the data provider page.
Data Provider Page
The data provider page now contains the following code:
<?php
	date_default_timezone_set("UTC");
	$now =  date("H:i:s", time());
	//Get random numbers
	$randomValueRetail = floor(rand(5,30));
	$randomValueOnline = floor(rand(1,10));
	//Output
   	echo  "&label=".$now."&value=".$randomValueRetail."|".$randomValueOnline;
?>
An example of how data values will be sent as output to the chart is given below:
In the data shown above, we have defined a common label that takes two values - one for each dataset. The values are separated using the | (pipe character). In the example above, 22 is the value for the Retail Store dataset and 7 is the value for the Online dataset. The order of values here should correspond with the order of dataset object arrays defined in the JSON/XML data.
Interactive legend
Like most other charts in the FusionCharts Suite XT, real-time charts with multiple datasets are also rendered with an interactive legend. An interactive legend is useful when, out of multiple datasets, you want to focus on only one. To hide a dataset, you click the corresponding data series name in the legend and the dataset will not be displayed. When the series name is clicked again, the dataset can be viewed on the chart.
The image below is a screenshot of the above real-time chart with the Online transactions dataset hidden:
Even when a dataset is not visible, it will continue updating itself in the background from the real-time data. Also, all alert managers associated with the dataset will continue to work.
If you do not need interactive legend, you can set it off using the following code snippet:
Pushing Multiple Updates
So far, for every dataset rendered on the chart, we have passed only single-value updates. FusionCharts Suite XT lets you pass multiple updates for each dataset at one time.
The example below shows the format you can use to push multiple updates at one time:
In the above example, we have provided three updates for each dataset present on the chart together. We have also provided three new labels for the x-axis, each label corresponding to each value update for both datasets.
When providing multiple values, values within a dataset should be comma-separated. For multiple datasets, each dataset should be separated by a | (pipe character).
A real-time chart with multiple updates for each dataset sent at one time looks like this:
{
    "chart": {
        "caption": "Harry's Supermart",
        "subCaption": "Retail Store vs Online Transactions",
        "dataStreamURL": "../../../resources/php/advance-charting-real-time-charts-multiple-datasets-and-updates-php-1.php",
        "refreshInterval": "5",
        "yaxismaxvalue": "40",
        "numdisplaysets": "10",
        "numbersuffix": " Customers",
        "showlabels": "1",
        "showValues": "0",
        "showRealTimeValue": "0",
        "theme": "fint"
    },
    "categories": [
        {
            "category": [
                {
                    "label": "Start"
                }
            ]
        }
    ],
    "dataset": [
        {
            "seriesname": "Retail Store",
            "alpha": "100",
            "data": [
                {
                    "value": "15"
                }
            ]
        },
        {
            "seriesname": "Online",
            "alpha": "100",
            "data": [
                {
                    "value": "2"
                }
            ]
        }
    ]
}
<html>
<head>
<title>My first chart using FusionCharts Suite XT</title>
<script type="text/javascript" src="http://static.fusioncharts.com/code/latest/fusioncharts.js"></script>
<script type="text/javascript" src="http://static.fusioncharts.com/code/latest/themes/fusioncharts.theme.fint.js?cacheBust=56"></script>
<script type="text/javascript">
FusionCharts.ready(function(){
var fusioncharts = new FusionCharts({
id: "mychart",
type: 'realtimecolumn',
renderAt: 'chart-container',
width: '600',
height: '300',
dataFormat: 'json',
dataSource: {
"chart": {
"caption": "Harry's Supermart",
"subCaption": "Retail Store vs Online Transactions",
"dataStreamURL": "../../../resources/php/advance-charting-real-time-charts-multiple-datasets-and-updates-php-1.php",
"refreshInterval": "5",
"yaxismaxvalue": "40",
"numdisplaysets": "10",
"numbersuffix": " Customers",
"showlabels": "1",
"showValues": "0",
"showRealTimeValue": "0",
"theme": "fint"
},
"categories": [{
"category": [{
"label": "Start"
}]
}],
"dataset": [{
"seriesname": "Retail Store",
"alpha": "100",
"data": [{
"value": "15"
}]
}, {
"seriesname": "Online",
"alpha": "100",
"data": [{
"value": "2"
}]
}]
}
}
);
fusioncharts.render();
});
</script>
</head>
<body>
<div id="chart-container">FusionCharts XT will load here!</div>
</body>
</html>In the above data, the dataStreamURL attribute is used to set advance-charting-real-time-charts-multiple-datasets-and-updates-php-1.php as the data provider page.
Data Provider Page
The updated data provider page advance-charting-real-time-charts-multiple-datasets-and-updates-php-1.php to output multiple values contains the following code:
<?php
	date_default_timezone_set("UTC");
	//Get random numbers
	$randomValueRetail1 = floor(rand(5,30));
	$randomValueRetail2 = floor(rand(5,30));
	$randomValueOnline1 = floor(rand(1,10));
	$randomValueOnline2 = floor(rand(1,10));
	//Times
	$time1 =  date('H:i:s', strtotime('-3 seconds'));
	$time2 =  date("H:i:s", time());
	//Output
   echo  "&label=".$time1.",".$time2."&value=".$randomValueRetail1.",".$randomValueRetail2."|".$randomValueOnline1.",".$randomValueOnline2;
?>
This page outputs the data in following format: