Demos

Beginner's Guide

Charts / Gauges / Maps Guide

Customizing Charts

API

Integrating With Your Stack

Help

Loading

The select-scatter chart is a special type of chart that allows users to visually select a subset of data from the given data points. Essentially, it is an extension of the XY plot chart (scatter chart) with the added functionality of selecting any number of points on the chart and returning them back to the server, or JavaScript functions, for further processing.

This can be used for a variety of purposes, where you want your users to visually select data from the scatter chart.

In this section, you will be shown how you can create a select-scatter chart and use its interactivity feature.

As an example, we will plot a select-scatter chart to show the products sold and the price points earned, for televisions and cell phones at Harry’s SuperMart in one week.

The select-scatter chart thus created looks like this:

FusionCharts will load here..
{ "chart": { "theme": "fint", "caption": "Products Sold vs. Price points", "subcaption": "Harry's SuperMart - Last Week", "yaxisname": "Quantity Sold", "xaxisname": "Price(In US $)", "xaxismaxvalue": "1000", "xaxisminvalue": "100", "yaxismaxvalue": "200", "xnumberprefix": "$", "ynumbersuffix": " units", "showcanvasborder": "1", "canvasborderthickness": "0.4", "canvasborderalpha": "50", "showXAxisLine": "0", "showformbtn": "1", "formAction": "#", "submitdataasxml": "1" }, "categories": [ { "verticallinecolor": "666666", "verticallinethickness": "1", "alpha": "40", "category": [ { "label": "$100", "x": "100", "showverticalline": "0" }, { "label": "$200", "x": "200", "showverticalline": "1" }, { "label": "$300", "x": "300", "showverticalline": "1" }, { "label": "$400", "x": "400", "showverticalline": "1" }, { "label": "$500", "x": "500", "showverticalline": "1" }, { "label": "$600", "x": "600", "showverticalline": "1" }, { "label": "$700", "x": "700", "showverticalline": "1" }, { "label": "$800", "x": "800", "showverticalline": "1" }, { "label": "$900", "x": "900", "showverticalline": "1" }, { "label": "$1000", "x": "1000", "showverticalline": "0" } ] } ], "dataset": [ { "drawline": "0", "seriesname": "Televisions", "color": "#6baa01", "anchorsides": "3", "anchorradius": "4", "anchorbgcolor": "#6baa01", "anchorbordercolor": "#6baa01", "data": [ { "id": "TV_1", "y": "559", "x": "714" }, { "id": "TV_2", "y": "293", "x": "988" }, { "id": "TV_3", "y": "231", "x": "970" }, { "id": "TV_4", "y": "528", "x": "142" }, { "id": "TV_5", "y": "95", "x": "800" }, { "id": "TV_6", "y": "515", "x": "813" }, { "id": "TV_7", "y": "444", "x": "928" }, { "id": "TV_8", "y": "592", "x": "238" }, { "id": "TV_9", "y": "229", "x": "959" }, { "id": "TV_10", "y": "238", "x": "521" }, { "id": "TV_11", "y": "285", "x": "222" }, { "id": "TV_12", "y": "524", "x": "863" }, { "id": "TV_13", "y": "422", "x": "820" }, { "id": "TV_14", "y": "344", "x": "894" }, { "id": "TV_15", "y": "510", "x": "800" }, { "id": "TV_16", "y": "132", "x": "785" }, { "id": "TV_17", "y": "381", "x": "214" }, { "id": "TV_18", "y": "210", "x": "961" }, { "id": "TV_19", "y": "496", "x": "575" }, { "id": "TV_20", "y": "330", "x": "847" }, { "id": "TV_21", "y": "436", "x": "893" }, { "id": "TV_22", "y": "406", "x": "157" }, { "id": "TV_23", "y": "125", "x": "349" }, { "id": "TV_24", "y": "450", "x": "818" }, { "id": "TV_25", "y": "455", "x": "615" }, { "id": "TV_26", "y": "328", "x": "256" }, { "id": "TV_27", "y": "188", "x": "460" }, { "id": "TV_28", "y": "565", "x": "350" }, { "id": "TV_29", "y": "149", "x": "582" }, { "id": "TV_30", "y": "425", "x": "970" } ] }, { "seriesname": "Cell Phones", "color": "#f8bd19", "anchorsides": "4", "anchorradius": "4", "anchorbgcolor": "#f8bd19", "anchorbordercolor": "#f8bd19", "data": [ { "id": "Mob_1", "y": "335", "x": "156" }, { "id": "Mob_2", "y": "339", "x": "927" }, { "id": "Mob_3", "y": "328", "x": "847" }, { "id": "Mob_4", "y": "1", "x": "177" }, { "id": "Mob_5", "y": "246", "x": "175" }, { "id": "Mob_6", "y": "368", "x": "441" }, { "id": "Mob_7", "y": "146", "x": "200" }, { "id": "Mob_8", "y": "347", "x": "482" }, { "id": "Mob_9", "y": "1", "x": "463" }, { "id": "Mob_10", "y": "63", "x": "440" }, { "id": "Mob_11", "y": "77", "x": "211" }, { "id": "Mob_12", "y": "108", "x": "824" }, { "id": "Mob_13", "y": "44", "x": "850" }, { "id": "Mob_14", "y": "77", "x": "712" }, { "id": "Mob_15", "y": "15", "x": "199" }, { "id": "Mob_16", "y": "333", "x": "836" }, { "id": "Mob_17", "y": "31", "x": "482" }, { "id": "Mob_18", "y": "90", "x": "604" }, { "id": "Mob_19", "y": "294", "x": "716" }, { "id": "Mob_20", "y": "241", "x": "870" }, { "id": "Mob_21", "y": "258", "x": "421" }, { "id": "Mob_22", "y": "186", "x": "456" }, { "id": "Mob_23", "y": "255", "x": "327" }, { "id": "Mob_24", "y": "203", "x": "995" }, { "id": "Mob_25", "y": "35", "x": "792" } ] } ] }
{
    "chart": {
        "theme": "fint",
        "caption": "Products Sold vs. Price points",
        "subcaption": "Harry's SuperMart - Last Week",
        "yaxisname": "Quantity Sold",
        "xaxisname": "Price(In US $)",
        "xaxismaxvalue": "1000",
        "xaxisminvalue": "100",
        "yaxismaxvalue": "200",
        "xnumberprefix": "$",
        "ynumbersuffix": " units",
        "showcanvasborder": "1",
        "canvasborderthickness": "0.4",
        "canvasborderalpha": "50",
        "showXAxisLine": "0",
        "showformbtn": "1",
        "formAction": "#",
        "submitdataasxml": "1"
    },
    "categories": [
        {
            "verticallinecolor": "666666",
            "verticallinethickness": "1",
            "alpha": "40",
            "category": [
                {
                    "label": "$100",
                    "x": "100",
                    "showverticalline": "0"
                },
                {
                    "label": "$200",
                    "x": "200",
                    "showverticalline": "1"
                },
                {
                    "label": "$300",
                    "x": "300",
                    "showverticalline": "1"
                },
                {
                    "label": "$400",
                    "x": "400",
                    "showverticalline": "1"
                },
                {
                    "label": "$500",
                    "x": "500",
                    "showverticalline": "1"
                },
                {
                    "label": "$600",
                    "x": "600",
                    "showverticalline": "1"
                },
                {
                    "label": "$700",
                    "x": "700",
                    "showverticalline": "1"
                },
                {
                    "label": "$800",
                    "x": "800",
                    "showverticalline": "1"
                },
                {
                    "label": "$900",
                    "x": "900",
                    "showverticalline": "1"
                },
                {
                    "label": "$1000",
                    "x": "1000",
                    "showverticalline": "0"
                }
            ]
        }
    ],
    "dataset": [
        {
            "drawline": "0",
            "seriesname": "Televisions",
            "color": "#6baa01",
            "anchorsides": "3",
            "anchorradius": "4",
            "anchorbgcolor": "#6baa01",
            "anchorbordercolor": "#6baa01",
            "data": [
                {
                    "id": "TV_1",
                    "y": "559",
                    "x": "714"
                },
                {
                    "id": "TV_2",
                    "y": "293",
                    "x": "988"
                },
                {
                    "id": "TV_3",
                    "y": "231",
                    "x": "970"
                },
                {
                    "id": "TV_4",
                    "y": "528",
                    "x": "142"
                },
                {
                    "id": "TV_5",
                    "y": "95",
                    "x": "800"
                },
                {
                    "id": "TV_6",
                    "y": "515",
                    "x": "813"
                },
                {
                    "id": "TV_7",
                    "y": "444",
                    "x": "928"
                },
                {
                    "id": "TV_8",
                    "y": "592",
                    "x": "238"
                },
                {
                    "id": "TV_9",
                    "y": "229",
                    "x": "959"
                },
                {
                    "id": "TV_10",
                    "y": "238",
                    "x": "521"
                },
                {
                    "id": "TV_11",
                    "y": "285",
                    "x": "222"
                },
                {
                    "id": "TV_12",
                    "y": "524",
                    "x": "863"
                },
                {
                    "id": "TV_13",
                    "y": "422",
                    "x": "820"
                },
                {
                    "id": "TV_14",
                    "y": "344",
                    "x": "894"
                },
                {
                    "id": "TV_15",
                    "y": "510",
                    "x": "800"
                },
                {
                    "id": "TV_16",
                    "y": "132",
                    "x": "785"
                },
                {
                    "id": "TV_17",
                    "y": "381",
                    "x": "214"
                },
                {
                    "id": "TV_18",
                    "y": "210",
                    "x": "961"
                },
                {
                    "id": "TV_19",
                    "y": "496",
                    "x": "575"
                },
                {
                    "id": "TV_20",
                    "y": "330",
                    "x": "847"
                },
                {
                    "id": "TV_21",
                    "y": "436",
                    "x": "893"
                },
                {
                    "id": "TV_22",
                    "y": "406",
                    "x": "157"
                },
                {
                    "id": "TV_23",
                    "y": "125",
                    "x": "349"
                },
                {
                    "id": "TV_24",
                    "y": "450",
                    "x": "818"
                },
                {
                    "id": "TV_25",
                    "y": "455",
                    "x": "615"
                },
                {
                    "id": "TV_26",
                    "y": "328",
                    "x": "256"
                },
                {
                    "id": "TV_27",
                    "y": "188",
                    "x": "460"
                },
                {
                    "id": "TV_28",
                    "y": "565",
                    "x": "350"
                },
                {
                    "id": "TV_29",
                    "y": "149",
                    "x": "582"
                },
                {
                    "id": "TV_30",
                    "y": "425",
                    "x": "970"
                }
            ]
        },
        {
            "seriesname": "Cell Phones",
            "color": "#f8bd19",
            "anchorsides": "4",
            "anchorradius": "4",
            "anchorbgcolor": "#f8bd19",
            "anchorbordercolor": "#f8bd19",
            "data": [
                {
                    "id": "Mob_1",
                    "y": "335",
                    "x": "156"
                },
                {
                    "id": "Mob_2",
                    "y": "339",
                    "x": "927"
                },
                {
                    "id": "Mob_3",
                    "y": "328",
                    "x": "847"
                },
                {
                    "id": "Mob_4",
                    "y": "1",
                    "x": "177"
                },
                {
                    "id": "Mob_5",
                    "y": "246",
                    "x": "175"
                },
                {
                    "id": "Mob_6",
                    "y": "368",
                    "x": "441"
                },
                {
                    "id": "Mob_7",
                    "y": "146",
                    "x": "200"
                },
                {
                    "id": "Mob_8",
                    "y": "347",
                    "x": "482"
                },
                {
                    "id": "Mob_9",
                    "y": "1",
                    "x": "463"
                },
                {
                    "id": "Mob_10",
                    "y": "63",
                    "x": "440"
                },
                {
                    "id": "Mob_11",
                    "y": "77",
                    "x": "211"
                },
                {
                    "id": "Mob_12",
                    "y": "108",
                    "x": "824"
                },
                {
                    "id": "Mob_13",
                    "y": "44",
                    "x": "850"
                },
                {
                    "id": "Mob_14",
                    "y": "77",
                    "x": "712"
                },
                {
                    "id": "Mob_15",
                    "y": "15",
                    "x": "199"
                },
                {
                    "id": "Mob_16",
                    "y": "333",
                    "x": "836"
                },
                {
                    "id": "Mob_17",
                    "y": "31",
                    "x": "482"
                },
                {
                    "id": "Mob_18",
                    "y": "90",
                    "x": "604"
                },
                {
                    "id": "Mob_19",
                    "y": "294",
                    "x": "716"
                },
                {
                    "id": "Mob_20",
                    "y": "241",
                    "x": "870"
                },
                {
                    "id": "Mob_21",
                    "y": "258",
                    "x": "421"
                },
                {
                    "id": "Mob_22",
                    "y": "186",
                    "x": "456"
                },
                {
                    "id": "Mob_23",
                    "y": "255",
                    "x": "327"
                },
                {
                    "id": "Mob_24",
                    "y": "203",
                    "x": "995"
                },
                {
                    "id": "Mob_25",
                    "y": "35",
                    "x": "792"
                }
            ]
        }
    ]
}
<html>
<head>
<title>My first chart using FusionCharts Suite XT</title>
<script type="text/javascript" src="http://static.fusioncharts.com/code/latest/fusioncharts.js"></script>
<script type="text/javascript" src="http://static.fusioncharts.com/code/latest/themes/fusioncharts.theme.fint.js?cacheBust=56"></script>
<script type="text/javascript">
  FusionCharts.ready(function(){
    var fusioncharts = new FusionCharts({
    type: 'selectscatter',
    id: 'chartId',
    renderAt: 'chart-container',
    width: '500',
    height: '350',
    dataFormat: 'json',
    dataSource: {
        "chart": {
            //Theme
            "theme": "fint",
            "caption": "Products Sold vs. Price points",
            "subcaption": "Harry's SuperMart - Last Week",
            "yaxisname": "Quantity Sold",
            "xaxisname": "Price(In US $)",
            "xaxismaxvalue": "1000",
            "xaxisminvalue": "100",
            "yaxismaxvalue": "200",
            "xnumberprefix": "$",
            "ynumbersuffix": " units",
            "showcanvasborder": "1",
            "canvasborderthickness": "0.4",
            "canvasborderalpha": "50",
            "showXAxisLine": "0",
            "showformbtn": "1",
            "formAction": "#",
            "submitdataasxml": "1"
        },
        "categories": [{
            "verticallinecolor": "666666",
            "verticallinethickness": "1",
            "alpha": "40",
            "category": [{
                "label": "$100",
                "x": "100",
                "showverticalline": "0"
            }, {
                "label": "$200",
                "x": "200",
                "showverticalline": "1"
            }, {
                "label": "$300",
                "x": "300",
                "showverticalline": "1"
            }, {
                "label": "$400",
                "x": "400",
                "showverticalline": "1"
            }, {
                "label": "$500",
                "x": "500",
                "showverticalline": "1"
            }, {
                "label": "$600",
                "x": "600",
                "showverticalline": "1"
            }, {
                "label": "$700",
                "x": "700",
                "showverticalline": "1"
            }, {
                "label": "$800",
                "x": "800",
                "showverticalline": "1"
            }, {
                "label": "$900",
                "x": "900",
                "showverticalline": "1"
            }, {
                "label": "$1000",
                "x": "1000",
                "showverticalline": "0"
            }]
        }],
        "dataset": [{
            "drawline": "0",
            "seriesname": "Televisions",
            "color": "#6baa01",
            "anchorsides": "3",
            "anchorradius": "4",
            "anchorbgcolor": "#6baa01",
            "anchorbordercolor": "#6baa01",
            "data": [{
                "id": "TV_1",
                "y": "559",
                "x": "714"
            }, {
                "id": "TV_2",
                "y": "293",
                "x": "988"
            }, {
                "id": "TV_3",
                "y": "231",
                "x": "970"
            }, {
                "id": "TV_4",
                "y": "528",
                "x": "142"
            }, {
                "id": "TV_5",
                "y": "95",
                "x": "800"
            }, {
                "id": "TV_6",
                "y": "515",
                "x": "813"
            }, {
                "id": "TV_7",
                "y": "444",
                "x": "928"
            }, {
                "id": "TV_8",
                "y": "592",
                "x": "238"
            }, {
                "id": "TV_9",
                "y": "229",
                "x": "959"
            }, {
                "id": "TV_10",
                "y": "238",
                "x": "521"
            }, {
                "id": "TV_11",
                "y": "285",
                "x": "222"
            }, {
                "id": "TV_12",
                "y": "524",
                "x": "863"
            }, {
                "id": "TV_13",
                "y": "422",
                "x": "820"
            }, {
                "id": "TV_14",
                "y": "344",
                "x": "894"
            }, {
                "id": "TV_15",
                "y": "510",
                "x": "800"
            }, {
                "id": "TV_16",
                "y": "132",
                "x": "785"
            }, {
                "id": "TV_17",
                "y": "381",
                "x": "214"
            }, {
                "id": "TV_18",
                "y": "210",
                "x": "961"
            }, {
                "id": "TV_19",
                "y": "496",
                "x": "575"
            }, {
                "id": "TV_20",
                "y": "330",
                "x": "847"
            }, {
                "id": "TV_21",
                "y": "436",
                "x": "893"
            }, {
                "id": "TV_22",
                "y": "406",
                "x": "157"
            }, {
                "id": "TV_23",
                "y": "125",
                "x": "349"
            }, {
                "id": "TV_24",
                "y": "450",
                "x": "818"
            }, {
                "id": "TV_25",
                "y": "455",
                "x": "615"
            }, {
                "id": "TV_26",
                "y": "328",
                "x": "256"
            }, {
                "id": "TV_27",
                "y": "188",
                "x": "460"
            }, {
                "id": "TV_28",
                "y": "565",
                "x": "350"
            }, {
                "id": "TV_29",
                "y": "149",
                "x": "582"
            }, {
                "id": "TV_30",
                "y": "425",
                "x": "970"
            }]
        }, {
            "seriesname": "Cell Phones",
            "color": "#f8bd19",
            "anchorsides": "4",
            "anchorradius": "4",
            "anchorbgcolor": "#f8bd19",
            "anchorbordercolor": "#f8bd19",
            "data": [{
                "id": "Mob_1",
                "y": "335",
                "x": "156"
            }, {
                "id": "Mob_2",
                "y": "339",
                "x": "927"
            }, {
                "id": "Mob_3",
                "y": "328",
                "x": "847"
            }, {
                "id": "Mob_4",
                "y": "1",
                "x": "177"
            }, {
                "id": "Mob_5",
                "y": "246",
                "x": "175"
            }, {
                "id": "Mob_6",
                "y": "368",
                "x": "441"
            }, {
                "id": "Mob_7",
                "y": "146",
                "x": "200"
            }, {
                "id": "Mob_8",
                "y": "347",
                "x": "482"
            }, {
                "id": "Mob_9",
                "y": "1",
                "x": "463"
            }, {
                "id": "Mob_10",
                "y": "63",
                "x": "440"
            }, {
                "id": "Mob_11",
                "y": "77",
                "x": "211"
            }, {
                "id": "Mob_12",
                "y": "108",
                "x": "824"
            }, {
                "id": "Mob_13",
                "y": "44",
                "x": "850"
            }, {
                "id": "Mob_14",
                "y": "77",
                "x": "712"
            }, {
                "id": "Mob_15",
                "y": "15",
                "x": "199"
            }, {
                "id": "Mob_16",
                "y": "333",
                "x": "836"
            }, {
                "id": "Mob_17",
                "y": "31",
                "x": "482"
            }, {
                "id": "Mob_18",
                "y": "90",
                "x": "604"
            }, {
                "id": "Mob_19",
                "y": "294",
                "x": "716"
            }, {
                "id": "Mob_20",
                "y": "241",
                "x": "870"
            }, {
                "id": "Mob_21",
                "y": "258",
                "x": "421"
            }, {
                "id": "Mob_22",
                "y": "186",
                "x": "456"
            }, {
                "id": "Mob_23",
                "y": "255",
                "x": "327"
            }, {
                "id": "Mob_24",
                "y": "203",
                "x": "995"
            }, {
                "id": "Mob_25",
                "y": "35",
                "x": "792"
            }]
        }]
    },
    events: {
        "beforeRender": function(evtObj, argObj) {
            // creating div for controllers
            var controllers = document.createElement('div');
            controllers.setAttribute('id', 'controllers');
            controllers.style.display = "inline-block";
            controllers.innerHTML = "<div id='tableView' style='width:500px;display:none;margin-left:0px;max-height:250px;overflow:scroll;border: 1px solid #CCCCCC;margin: 3px;float: left;display:none; color: #666666;font-family:'Arial','Helvetica';font-size: 12px;'></div>";
            //Display container div and write table
            argObj.container.parentNode.insertBefore(controllers, argObj.container.nextSibling);
            /*
             * getDataFromChart method prepares the
             * tabular string from selection and
             * write in a div and display it.
             */
            getDataFromChart = function() {
                var i,
                    j,
                    str,
                    ds = "",
                    dataArr,
                    flagData = false,
                    objDataset = evtObj.sender.getJSONData && evtObj.sender.getJSONData().dataset,
                    tableContainer = document.getElementById("tableView");

                //Form tabular string
                str = "<div style='margin:3px;font-family:'Arial','Helvetica';font-size: 12px;'> Data is returned by the chart as Array. The data is converted into tabular format using JavaScript.</div>";
                str += '<table border="1" cellpadding="1" cellspacing="0" bordercolor="#ffffff" width="100%">';
                for (i in objDataset) {
                    dataArr = objDataset[i].data;
                    if (dataArr.length > 0) {
                        flagData = true;
                        str += '    <tr>';
                        str += '        <td width="20%" style="font-weight: bold;font-size: 14px;vertical-align: top;text-align:right;padding: 3px" color="' + objDataset[i].color + '">' + objDataset[i].seriesname + '</td>';

                        ds = '<table border="1" cellpadding="1" cellspacing="0" bordercolor="' + objDataset[i].color + '" width="100%">';
                        ds += '<tr>';
                        ds += '<td width="20%" style="font-weight: bold;font-size: 12px;background-color: #EEEEEE;text-align:center"> Id</td>';
                        ds += '<td width="40%" style="font-weight: bold;font-size: 12px;background-color: #EEEEEE;text-align:center"> Price (in USD)</td>';
                        ds += '<td width="40%" style="font-weight: bold;font-size: 12px;background-color: #EEEEEE;text-align:center"> Quantity Sold</td>';
                        ds += '</tr>';
                        for (j = 0; j < dataArr.length; j++) {
                            var id = String(dataArr[j].id),
                                price = String(dataArr[j].x),
                                qty = String(dataArr[j].y);

                            ds += '<tr>';
                            ds += '<td width="20%" align="center">' + id + '</td>';
                            ds += '<td width="40%" align="center">&#36;' + price + ' </td>';
                            ds += '<td width="40%" align="center">' + qty + ' units</td>';
                            ds += '</tr>';
                        }
                        ds += '</table>';
                        str += '        <td width="80%" style="padding: 3px">' + ds + '</td>';
                        str += '    </tr>';
                    }

                }
                str += '</table>';
                if (!flagData) {
                    str = "No Data Selected";
                }
                tableContainer.style.display = "block";
                tableContainer.innerHTML = str;
            }
        },
        "beforeDataSubmit": function(evtObj, argObj) {
            getDataFromChart();

        },
        "dataRestored": function(evtObj, argObj) {
            document.getElementById("tableView").style.display = "none";
            document.getElementById("tableView").innerHTML = "";
        }
    }
}
);
    fusioncharts.render();
});
</script>
</head>
<body>
  <div id="chart-container">FusionCharts XT will load here!</div>
</body>
</html>

To select a set of points, you can drag and draw a rectangle over the chart. All the points within this rectangle are now selected points. Once the rectangle has been drawn, you can resize it to adjust more points. The resize handlers let you do so.

To select more scattered data points, you can add additional select rectangles on the chart. The process to add another select rectangle is the same, as shown in the image below. Click anywhere in the chart canvas and draw a rectangle.

image creating-select-scatter

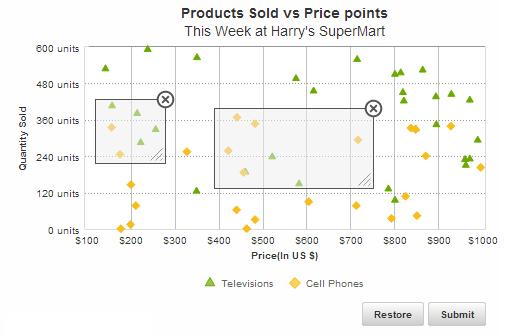
You can drag, resize, or delete any select rectangles individually. To delete any select rectangle, you can click the “X” “at the top right corner of the selection box and the rectangle will be gone.

In the above chart, drag the mouse pointer across the chart to select a subset of data points. Once the selection process is over, click the Submit button. This button sends the JSON/XML data as a form to the server-side script. In the above sample, the JSON data for the selected points - the price and quantity of each tv/cell phone unit - have been displayed in a table. Click the Restore button to bring back the chart to its original state.

Top