Loading
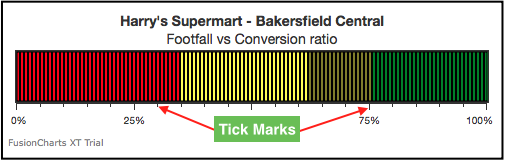
Tick Marks
Tick marks, an element of gauges in FusionChart Suite XT, are calibration marks on the scale to help interpret readings on a gauge. There are two types of tick marks that can be drawn on the chart:
-
Major Tick Marks – These are the bigger lines on the radial scale
-
Minor Tick Marks – These are the smaller lines interspersed within the major tick marks
A LED gauge with major and minor tick marks looks like this:
This section talks about:
Showing/hiding tick marks and tick values
A LED gauge with tick marks and tick values hidden looks as below:
{
    "chart": {
        "caption": "Harry's Supermart - Bakersfield Central",
        "subCaption": "Footfall vs Conversion ratio",
        "numberSuffix": "%",
        "showTickMarks": "0",
        "showTickValues": "0",
        "theme": "fint"
    },
    "colorrange": {
        "color": [
            {
                "minvalue": "100",
                "maxvalue": "76",
                "label": "Bad",
                "code": "#00FF00"
            },
            {
                "minvalue": "75",
                "maxvalue": "36",
                "label": "Average",
                "code": "#FFFF00"
            },
            {
                "minvalue": "0",
                "maxvalue": "35",
                "label": "Good",
                "code": "#FF0000"
            }
        ]
    },
    "value": "62"
}
<html>
<head>
<title>My first chart using FusionCharts Suite XT</title>
<script type="text/javascript" src="http://static.fusioncharts.com/code/latest/fusioncharts.js"></script>
<script type="text/javascript" src="http://static.fusioncharts.com/code/latest/themes/fusioncharts.theme.fint.js?cacheBust=56"></script>
<script type="text/javascript">
FusionCharts.ready(function(){
var fusioncharts = new FusionCharts({
type: 'hled',
renderAt: 'chart-container',
id: 'myChart',
width: '500',
height: '120',
dataFormat: 'json',
dataSource: {
"chart": {
"caption": "Harry's Supermart - Bakersfield Central",
"subCaption": "Footfall vs Conversion ratio",
"numberSuffix": "%",
//Hiding tick marks and values
"showTickMarks": "0",
"showTickValues": "0",
"theme": "fint"
},
"colorrange": {
"color": [{
"minvalue": "100",
"maxvalue": "76",
"label": "Bad",
"code": "#00FF00"
}, {
"minvalue": "75",
"maxvalue": "36",
"label": "Average",
"code": "#FFFF00"
}, {
"minvalue": "0",
"maxvalue": "35",
"label": "Good",
"code": "#FF0000"
}]
},
"value": "62"
}
}
);
fusioncharts.render();
});
</script>
</head>
<body>
<div id="chart-container">FusionCharts XT will load here!</div>
</body>
</html>The following attributes can be used to show/hide tick marks and tick values:
| Attribute | Description |
|---|---|
|
Set this to to |
|
Set this to |
|
Set this to |
Configuring the tick value position
By default, tick marks and tick values are placed outside a gauge. In vertical gauges (like the vertical LED gauge), by default, they are placed to the right of the gauge. Similarly, in horizontal gauges (like the horizontal LED gauge), they are placed below the gauge. FusionCharts Suite XT allows you to customize the placement of tick marks and tick values.
An angular gauge with tick marks and tick values placed inside looks as below:
{
    "chart": {
        "caption": "Customer Satisfaction Score",
        "subcaption": "Last week",
        "placeTicksInside": "1",
        "placeValuesInside": "1",
        "theme": "fint"
    },
    "colorRange": {
        "color": [
            {
                "minValue": "0",
                "maxValue": "50",
                "code": "#e44a00"
            },
            {
                "minValue": "50",
                "maxValue": "75",
                "code": "#f8bd19"
            },
            {
                "minValue": "75",
                "maxValue": "100",
                "code": "#6baa01"
            }
        ]
    },
    "dials": {
        "dial": [
            {
                "value": "67"
            }
        ]
    }
}
<html>
<head>
<title>My first chart using FusionCharts Suite XT</title>
<script type="text/javascript" src="http://static.fusioncharts.com/code/latest/fusioncharts.js"></script>
<script type="text/javascript" src="http://static.fusioncharts.com/code/latest/themes/fusioncharts.theme.fint.js?cacheBust=56"></script>
<script type="text/javascript">
FusionCharts.ready(function(){
var fusioncharts = new FusionCharts({
type: 'angulargauge',
renderAt: 'chart-container',
width: '400',
height: '250',
dataFormat: 'json',
dataSource: {
"chart": {
"caption": "Customer Satisfaction Score",
"subcaption": "Last week",
//Place tick marks and values inside gauge
"placeTicksInside": "1",
"placeValuesInside": "1",
"theme": "fint"
},
"colorRange": {
"color": [{
"minValue": "0",
"maxValue": "50",
"code": "#e44a00"
}, {
"minValue": "50",
"maxValue": "75",
"code": "#f8bd19"
}, {
"minValue": "75",
"maxValue": "100",
"code": "#6baa01"
}]
},
"dials": {
"dial": [{
"value": "67"
}]
}
}
}
);
fusioncharts.render();
});
</script>
</head>
<body>
<div id="chart-container">FusionCharts XT will load here!</div>
</body>
</html>Following is the list of attributes for configuring tick mark position and tick values:
| Attribute | Description |
|---|---|
|
Set this to |
|
Set this to |
A linear gauge with tick marks and tick values placed above looks as below:
{
    "chart": {
        "caption": "Harry's Supermart - Bakersfield Central",
        "subCaption": "Footfall vs Conversion ratio",
        "numberSuffix": "%",
        "ticksBelowGauge": "0",
        "theme": "fint"
    },
    "colorrange": {
        "color": [
            {
                "minvalue": "100",
                "maxvalue": "76",
                "label": "Bad",
                "code": "#00FF00"
            },
            {
                "minvalue": "75",
                "maxvalue": "36",
                "label": "Average",
                "code": "#FFFF00"
            },
            {
                "minvalue": "0",
                "maxvalue": "35",
                "label": "Good",
                "code": "#FF0000"
            }
        ]
    },
    "value": "62"
}
<html>
<head>
<title>My first chart using FusionCharts Suite XT</title>
<script type="text/javascript" src="http://static.fusioncharts.com/code/latest/fusioncharts.js"></script>
<script type="text/javascript" src="http://static.fusioncharts.com/code/latest/themes/fusioncharts.theme.fint.js?cacheBust=56"></script>
<script type="text/javascript">
FusionCharts.ready(function(){
var fusioncharts = new FusionCharts({
type: 'hled',
renderAt: 'chart-container',
id: 'myChart',
width: '500',
height: '150',
dataFormat: 'json',
dataSource: {
"chart": {
"caption": "Harry's Supermart - Bakersfield Central",
"subCaption": "Footfall vs Conversion ratio",
"numberSuffix": "%",
//Configuring ticks to appear above gauge
"ticksBelowGauge": "0",
"theme": "fint"
},
"colorrange": {
"color": [{
"minvalue": "100",
"maxvalue": "76",
"label": "Bad",
"code": "#00FF00"
}, {
"minvalue": "75",
"maxvalue": "36",
"label": "Average",
"code": "#FFFF00"
}, {
"minvalue": "0",
"maxvalue": "35",
"label": "Good",
"code": "#FF0000"
}]
},
"value": "62"
}
}
);
fusioncharts.render();
});
</script>
</head>
<body>
<div id="chart-container">FusionCharts XT will load here!</div>
</body>
</html>Given below is the attribute used to configure tick mark position and tick values for a horizontal gauge.
| Attribute | Description |
|---|---|
|
Set this to |
Similarly for a vertical gauge, tick marks and tick values can be placed on the right or left. Given below is the attribute used to configure the position of tick marks and tick values for a vertical gauge:
| Attribute | Description |
|---|---|
|
Set this to |
Showing every nth tick mark value
FusionCharts allows you to show every n-th value, where the upper and lower limit of the scale is always displayed. A Horizontal LED gauge displaying n-th value looks as below:
{
    "chart": {
        "caption": "Harry's Supermart - Bakersfield Central",
        "subCaption": "Footfall vs Conversion ratio",
        "tickValueStep": "2",
        "numberSuffix": "%",
        "showTickMarks": "1",
        "showTickValues": "1",
        "theme": "fint"
    },
    "colorrange": {
        "color": [
            {
                "minvalue": "100",
                "maxvalue": "76",
                "label": "Bad",
                "code": "#00FF00"
            },
            {
                "minvalue": "75",
                "maxvalue": "36",
                "label": "Average",
                "code": "#FFFF00"
            },
            {
                "minvalue": "0",
                "maxvalue": "35",
                "label": "Good",
                "code": "#FF0000"
            }
        ]
    },
    "value": "62"
}
<html>
<head>
<title>My first chart using FusionCharts Suite XT</title>
<script type="text/javascript" src="http://static.fusioncharts.com/code/latest/fusioncharts.js"></script>
<script type="text/javascript" src="http://static.fusioncharts.com/code/latest/themes/fusioncharts.theme.fint.js?cacheBust=56"></script>
<script type="text/javascript">
FusionCharts.ready(function(){
var fusioncharts = new FusionCharts({
type: 'hled',
renderAt: 'chart-container',
id: 'myChart',
width: '500',
height: '150',
dataFormat: 'json',
dataSource: {
"chart": {
"caption": "Harry's Supermart - Bakersfield Central",
"subCaption": "Footfall vs Conversion ratio",
"tickValueStep": "2", //n-th value gets displayed
"numberSuffix": "%",
"showTickMarks": "1",
"showTickValues": "1",
"theme": "fint"
},
"colorrange": {
"color": [{
"minvalue": "100",
"maxvalue": "76",
"label": "Bad",
"code": "#00FF00"
}, {
"minvalue": "75",
"maxvalue": "36",
"label": "Average",
"code": "#FFFF00"
}, {
"minvalue": "0",
"maxvalue": "35",
"label": "Good",
"code": "#FF0000"
}]
},
"value": "62"
}
});
fusioncharts.render();
});
</script>
</head>
<body>
<div id="chart-container">FusionCharts XT will load here!</div>
</body>
</html>Given below is the attribute used to every n-th tick value for a horizontal led gauge:
| Attribute | Description |
|---|---|
|
This attribute specifies every n-th tick value of the gauge, where upper and lower limit of the scale is always displayed. |
Showing tick values in decimals
You can configure number of decimals and can also force the number of decimals on tick values. A horizontal LED gauge showing tick value in decimals looks as below:
{
    "chart": {
        "caption": "Harry's Supermart - Bakersfield Central",
        "subCaption": "Footfall vs Conversion ratio",
        "tickValueDecimals": "3",
        "numberSuffix": "%",
        "showTickMarks": "1",
        "showTickValues": "1",
        "theme": "fint"
    },
    "colorrange": {
        "color": [
            {
                "minvalue": "100",
                "maxvalue": "76.555",
                "label": "Bad",
                "code": "#00FF00"
            },
            {
                "minvalue": "75",
                "maxvalue": "36",
                "label": "Average",
                "code": "#FFFF00"
            },
            {
                "minvalue": "0",
                "maxvalue": "35",
                "label": "Good",
                "code": "#FF0000"
            }
        ]
    },
    "value": "62"
}
<html>
<head>
<title>My first chart using FusionCharts Suite XT</title>
<script type="text/javascript" src="http://static.fusioncharts.com/code/latest/fusioncharts.js"></script>
<script type="text/javascript" src="http://static.fusioncharts.com/code/latest/themes/fusioncharts.theme.fint.js?cacheBust=56"></script>
<script type="text/javascript">
FusionCharts.ready(function(){
var fusioncharts = new FusionCharts({
type: 'hled',
renderAt: 'chart-container',
id: 'myChart',
width: '500',
height: '150',
dataFormat: 'json',
dataSource: {
"chart": {
"caption": "Harry's Supermart - Bakersfield Central",
"subCaption": "Footfall vs Conversion ratio",
"tickValueDecimals": "3",
"numberSuffix": "%",
"showTickMarks": "1",
"showTickValues": "1",
"theme": "fint"
},
"colorrange": {
"color": [{
"minvalue": "100",
"maxvalue": "76.555",
"label": "Bad",
"code": "#00FF00"
}, {
"minvalue": "75",
"maxvalue": "36",
"label": "Average",
"code": "#FFFF00"
}, {
"minvalue": "0",
"maxvalue": "35",
"label": "Good",
"code": "#FF0000"
}]
},
"value": "62"
}
});
fusioncharts.render();
});
</script>
</head>
<body>
<div id="chart-container">FusionCharts XT will load here!</div>
</body>
</html>Given below are the attributes used to configure tick values in decimals:
| Attribute | Description |
|---|---|
|
This attribute specifies the number of decimals to which tick values will be rounded to. |
|
This attribute when set to |
Configuring tick mark and tick value padding
By setting the tick mark padding and tick value padding, you can control the amount of space between the tick mark and the gauge or between the tick values and tick marks. A horizontal led gauge with tick mark and tick values with defined padding is shown below:
{
    "chart": {
        "caption": "Harry's Supermart - Bakersfield Central",
        "subCaption": "Footfall vs Conversion ratio",
        "tickMarkDistance": "10",
        "tickValueDistance": "10",
        "numberSuffix": "%",
        "showTickMarks": "1",
        "showTickValues": "1",
        "theme": "fint"
    },
    "colorrange": {
        "color": [
            {
                "minvalue": "100",
                "maxvalue": "76.444",
                "label": "Bad",
                "code": "#00FF00"
            },
            {
                "minvalue": "75",
                "maxvalue": "36",
                "label": "Average",
                "code": "#FFFF00"
            },
            {
                "minvalue": "0",
                "maxvalue": "35",
                "label": "Good",
                "code": "#FF0000"
            }
        ]
    },
    "value": "62"
}
<html>
<head>
<title>My first chart using FusionCharts Suite XT</title>
<script type="text/javascript" src="http://static.fusioncharts.com/code/latest/fusioncharts.js"></script>
<script type="text/javascript" src="http://static.fusioncharts.com/code/latest/themes/fusioncharts.theme.fint.js?cacheBust=56"></script>
<script type="text/javascript">
FusionCharts.ready(function(){
var fusioncharts = new FusionCharts({
type: 'hled',
renderAt: 'chart-container',
id: 'myChart',
width: '500',
height: '170',
dataFormat: 'json',
dataSource: {
"chart": {
"caption": "Harry's Supermart - Bakersfield Central",
"subCaption": "Footfall vs Conversion ratio",
"tickMarkDistance": "10", //Distance between the gauge and the tick marks
"tickValueDistance": "10", //Distance between tick values and tick marks
"numberSuffix":"%",
"showTickMarks":"1",
"showTickValues":"1",
"theme": "fint"
},
"colorrange": {
"color": [
{
"minvalue": "100",
"maxvalue": "76.444",
"label": "Bad",
"code": "#00FF00"
},
{
"minvalue": "75",
"maxvalue": "36",
"label": "Average",
"code": "#FFFF00"
},
{
"minvalue": "0",
"maxvalue": "35",
"label": "Good",
"code": "#FF0000"
}
]
},
"value": "62"
}
});
fusioncharts.render();
});
</script>
</head>
<body>
<div id="chart-container">FusionCharts XT will load here!</div>
</body>
</html>Given below are the attributes used to set the padding for gauge, tick marks and tick values:
| Attribute | Description |
|---|---|
|
This attribute specifies the distance between the gauge and the tick marks(in pixels). |
|
This attribute specifies the distance between tick values and tick marks(in pixels). |
Configuring the number of major and minor tick marks
FusionCharts Suite XT allows to you to define the number of major and minor tick marks to be rendered on a gauge. A horizontal LED gauge with the number of tick marks manually configured looks as below:
{
    "chart": {
        "caption": "Harry's Supermart - Bakersfield Central",
        "subCaption": "Footfall vs Conversion ratio",
        "numberSuffix": "%",
        "ticksBelowGauge": "0",
        "majorTMNumber": "11",
        "minorTMNumber": "4",
        "tickValueStep": "2",
        "theme": "fint"
    },
    "colorrange": {
        "color": [
            {
                "minvalue": "100",
                "maxvalue": "76",
                "label": "Bad",
                "code": "#00FF00"
            },
            {
                "minvalue": "75",
                "maxvalue": "36",
                "label": "Average",
                "code": "#FFFF00"
            },
            {
                "minvalue": "0",
                "maxvalue": "35",
                "label": "Good",
                "code": "#FF0000"
            }
        ]
    },
    "value": "62"
}
<html>
<head>
<title>My first chart using FusionCharts Suite XT</title>
<script type="text/javascript" src="http://static.fusioncharts.com/code/latest/fusioncharts.js"></script>
<script type="text/javascript" src="http://static.fusioncharts.com/code/latest/themes/fusioncharts.theme.fint.js?cacheBust=56"></script>
<script type="text/javascript">
FusionCharts.ready(function(){
var fusioncharts = new FusionCharts({
type: 'hled',
renderAt: 'chart-container',
id: 'myChart',
width: '500',
height: '150',
dataFormat: 'json',
dataSource: {
"chart": {
"caption": "Harry's Supermart - Bakersfield Central",
"subCaption": "Footfall vs Conversion ratio",
"numberSuffix": "%",
"ticksBelowGauge": "0",
//Setting number of major tick marks to 11
"majorTMNumber": "11",
"minorTMNumber": "4",
//Show tick value for every 2nd major tick mark
"tickValueStep": "2",
"theme": "fint"
},
"colorrange": {
"color": [{
"minvalue": "100",
"maxvalue": "76",
"label": "Bad",
"code": "#00FF00"
}, {
"minvalue": "75",
"maxvalue": "36",
"label": "Average",
"code": "#FFFF00"
}, {
"minvalue": "0",
"maxvalue": "35",
"label": "Good",
"code": "#FF0000"
}]
},
"value": "62"
}
}
);
fusioncharts.render();
});
</script>
</head>
<body>
<div id="chart-container">FusionCharts XT will load here!</div>
</body>
</html>Given below is a list of attributes used to configure the number of tick marks:
| Attribute | Description |
|---|---|
|
If set to |
|
They specify the number of major and minor tick marks, respectively, to be rendered on the gauge. Accepts a non-negative integer. |
Configuring cosmetic properties of tick marks
You can configure the color, transparency, height, and thickness of both, major and minor tick marks. A horizontal LED gauge with customized tick marks looks as below:
{
    "chart": {
        "caption": "Harry's Supermart - Bakersfield Central",
        "subCaption": "Footfall vs Conversion ratio",
        "numberSuffix": "%",
        "tickMarkDistance": "4",
        "majorTMNumber": "5",
        "minorTMNumber": "4",
        "majorTMColor": "#666666",
        "majorTMAlpha": "70",
        "majorTMHeight": "10",
        "majorTMThickness": "2",
        "minorTMColor": "#cccccc",
        "minorTMAlpha": "100",
        "minorTMHeight": "6",
        "minorTMThickness": "1",
        "theme": "fint"
    },
    "colorrange": {
        "color": [
            {
                "minvalue": "100",
                "maxvalue": "76",
                "label": "Bad",
                "code": "#00FF00"
            },
            {
                "minvalue": "75",
                "maxvalue": "36",
                "label": "Average",
                "code": "#FFFF00"
            },
            {
                "minvalue": "0",
                "maxvalue": "35",
                "label": "Good",
                "code": "#FF0000"
            }
        ]
    },
    "value": "62"
}
<html>
<head>
<title>My first chart using FusionCharts Suite XT</title>
<script type="text/javascript" src="http://static.fusioncharts.com/code/latest/fusioncharts.js"></script>
<script type="text/javascript" src="http://static.fusioncharts.com/code/latest/themes/fusioncharts.theme.fint.js?cacheBust=56"></script>
<script type="text/javascript">
FusionCharts.ready(function(){
var fusioncharts = new FusionCharts({
type: 'hled',
renderAt: 'chart-container',
id: 'myChart',
width: '500',
height: '160',
dataFormat: 'json',
dataSource: {
"chart": {
"caption": "Harry's Supermart - Bakersfield Central",
"subCaption": "Footfall vs Conversion ratio",
"numberSuffix": "%",
//Distance bbetween tick mark scale and gauge
"tickMarkDistance": "4",
"majorTMNumber": "5",
"minorTMNumber": "4",
//Cosmetics for major tick marks
"majorTMColor": "#666666",
"majorTMAlpha": "70",
"majorTMHeight": "10",
"majorTMThickness": "2",
//Cosmetics for minor tick marks
"minorTMColor": "#cccccc",
"minorTMAlpha": "100",
"minorTMHeight": "6",
"minorTMThickness": "1",
"theme": "fint"
},
"colorrange": {
"color": [{
"minvalue": "100",
"maxvalue": "76",
"label": "Bad",
"code": "#00FF00"
}, {
"minvalue": "75",
"maxvalue": "36",
"label": "Average",
"code": "#FFFF00"
}, {
"minvalue": "0",
"maxvalue": "35",
"label": "Good",
"code": "#FF0000"
}]
},
"value": "62"
}
}
);
fusioncharts.render();
});
</script>
</head>
<body>
<div id="chart-container">FusionCharts XT will load here!</div>
</body>
</html>Given below is the list of attributes used to configure cosmetic properties of tick marks:
| Attribute | Description |
|---|---|
|
They specify the hex code of the color, e.g |
|
They specify the transparency of the major and minor tick marks, respectively, with values from |
|
They specify the height of the major and minor tick marks in pixels, respectively. |
|
They specify the thickness of the major and minor tick marks in pixels, respectively. |