Loading
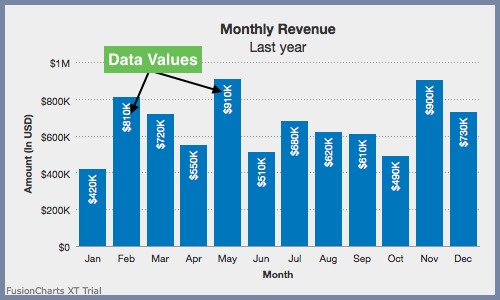
Data Values
Data values are plot values i.e. values of each data plot (line, column, bar, pie) displayed on the chart.
This section talks about:
Configuring text labels instead of numeric data values
Instead of displaying numeric data values, you can use text labels to denote data values for each data item.
A column 2D chart with custom text instead of numeric data values looks as below:
{
    "chart": {
        "theme": "fint",
        "caption": "Quarterly Revenue",
        "subcaption": "Last year",
        "xAxisName": "Quarter",
        "yAxisName": "Amount (In USD)",
        "numberPrefix": "$"
    },
    "data": [
        {
            "label": "Q1",
            "value": "1950000"
        },
        {
            "label": "Q2",
            "value": "1450000"
        },
        {
            "label": "Q3",
            "value": "1730000"
        },
        {
            "label": "Q4",
            "value": "2120000",
            "displayValue": "Year's best"
        }
    ]
}
<html>
<head>
<title>My first chart using FusionCharts Suite XT</title>
<script type="text/javascript" src="http://static.fusioncharts.com/code/latest/fusioncharts.js"></script>
<script type="text/javascript" src="http://static.fusioncharts.com/code/latest/themes/fusioncharts.theme.fint.js?cacheBust=56"></script>
<script type="text/javascript">
FusionCharts.ready(function(){
var fusioncharts = new FusionCharts({
type: 'column2d',
renderAt: 'chart-container',
id: 'myChart',
width: '450',
height: '300',
dataFormat: 'json',
dataSource: {
"chart": {
"theme": "fint",
"caption": "Quarterly Revenue",
"subcaption": "Last year",
"xAxisName": "Quarter",
"yAxisName": "Amount (In USD)",
"numberPrefix": "$"
},
"data": [{
"label": "Q1",
"value": "1950000"
}, {
"label": "Q2",
"value": "1450000"
}, {
"label": "Q3",
"value": "1730000"
}, {
"label": "Q4",
"value": "2120000",
//Custom display string
"displayValue": "Year's best"
}]
}
}
);
fusioncharts.render();
});
</script>
</head>
<body>
<div id="chart-container">FusionCharts XT will load here!</div>
</body>
</html>Given below is the attribute used to configure text as the data value:
Name |
Description |
|
Used to display a custom text instead of the numerical value of data. |
Configuring rotation of data values
You can display data values in the following modes:
-
Normal mode
-
Rotated mode
Normal Mode
In the normal mode, you can display data values horizontally as shown below:
{
    "chart": {
        "theme": "fint",
        "caption": "Quarterly Revenue",
        "subcaption": "Last year",
        "xAxisName": "Quarter",
        "yAxisName": "Amount (In USD)",
        "numberPrefix": "$",
        "rotateValues": "0"
    },
    "data": [
        {
            "label": "Q1",
            "value": "1950000"
        },
        {
            "label": "Q2",
            "value": "1450000"
        },
        {
            "label": "Q3",
            "value": "1730000"
        },
        {
            "label": "Q4",
            "value": "2120000"
        }
    ]
}
<html>
<head>
<title>My first chart using FusionCharts Suite XT</title>
<script type="text/javascript" src="http://static.fusioncharts.com/code/latest/fusioncharts.js"></script>
<script type="text/javascript" src="http://static.fusioncharts.com/code/latest/themes/fusioncharts.theme.fint.js?cacheBust=56"></script>
<script type="text/javascript">
FusionCharts.ready(function(){
var fusioncharts = new FusionCharts({
type: 'column2d',
renderAt: 'chart-container',
id: 'myChart',
width: '450',
height: '300',
dataFormat: 'json',
dataSource: {
"chart": {
"theme": "fint",
"caption": "Quarterly Revenue",
"subcaption": "Last year",
"xAxisName": "Quarter",
"yAxisName": "Amount (In USD)",
"numberPrefix": "$",
"rotateValues": "0",
},
"data": [{
"label": "Q1",
"value": "1950000"
}, {
"label": "Q2",
"value": "1450000"
}, {
"label": "Q3",
"value": "1730000"
}, {
"label": "Q4",
"value": "2120000"
}]
}
}
);
fusioncharts.render();
});
</script>
</head>
<body>
<div id="chart-container">FusionCharts XT will load here!</div>
</body>
</html>Rotated Mode
In the rotated mode, you can rotate data values in a chart as shown below
{
    "chart": {
        "theme": "fint",
        "caption": "Quarterly Revenue",
        "subcaption": "Last year",
        "xAxisName": "Quarter",
        "yAxisName": "Amount (In USD)",
        "numberPrefix": "$",
        "rotateValues": "1"
    },
    "data": [
        {
            "label": "Q1",
            "value": "1950000"
        },
        {
            "label": "Q2",
            "value": "1450000"
        },
        {
            "label": "Q3",
            "value": "1730000"
        },
        {
            "label": "Q4",
            "value": "2120000"
        }
    ]
}
<html>
<head>
<title>My first chart using FusionCharts Suite XT</title>
<script type="text/javascript" src="http://static.fusioncharts.com/code/latest/fusioncharts.js"></script>
<script type="text/javascript" src="http://static.fusioncharts.com/code/latest/themes/fusioncharts.theme.fint.js?cacheBust=56"></script>
<script type="text/javascript">
FusionCharts.ready(function(){
var fusioncharts = new FusionCharts({
type: 'column2d',
renderAt: 'chart-container',
id: 'myChart',
width: '450',
height: '300',
dataFormat: 'json',
dataSource: {
"chart": {
"theme": "fint",
"caption": "Quarterly Revenue",
"subcaption": "Last year",
"xAxisName": "Quarter",
"yAxisName": "Amount (In USD)",
"numberPrefix": "$",
//Used to display rotated values
"rotateValues": "1"
},
"data": [{
"label": "Q1",
"value": "1950000"
}, {
"label": "Q2",
"value": "1450000"
}, {
"label": "Q3",
"value": "1730000"
}, {
"label": "Q4",
"value": "2120000"
}]
}
}
);
fusioncharts.render();
});
</script>
</head>
<body>
<div id="chart-container">FusionCharts XT will load here!</div>
</body>
</html>Given below is the attribute used to rotate data values in the chart:
| Name | Description |
|---|---|
|
Set to |
Configuring placement of data values inside columns
You can place data values inside a chart and you can also rotate it for better clarity.
A column 2D chart with data values placed inside columns looks as shown below:
{
    "chart": {
        "caption": "Quarterly Revenue",
        "subcaption": "Last year",
        "xAxisName": "Quarter",
        "yAxisName": "Amount (In USD)",
        "numberPrefix": "$",
        "placevaluesInside": "1",
        "theme": "fint"
    },
    "data": [
        {
            "label": "Q1",
            "value": "1950000"
        },
        {
            "label": "Q2",
            "value": "1450000"
        },
        {
            "label": "Q3",
            "value": "1730000"
        },
        {
            "label": "Q4",
            "value": "2120000"
        }
    ]
}
<html>
<head>
<title>My first chart using FusionCharts Suite XT</title>
<script type="text/javascript" src="http://static.fusioncharts.com/code/latest/fusioncharts.js"></script>
<script type="text/javascript" src="http://static.fusioncharts.com/code/latest/themes/fusioncharts.theme.fint.js?cacheBust=56"></script>
<script type="text/javascript">
FusionCharts.ready(function(){
var fusioncharts = new FusionCharts({
type: 'column2d',
renderAt: 'chart-container',
id: 'myChart',
width: '450',
height: '300',
dataFormat: 'json',
dataSource: {
"chart": {
"caption": "Quarterly Revenue",
"subcaption": "Last year",
"xAxisName": "Quarter",
"yAxisName": "Amount (In USD)",
"numberPrefix": "$",
//Place the value inside the plots
"placevaluesInside": "1",
//Theme
"theme": "fint"
},
"data": [{
"label": "Q1",
"value": "1950000"
}, {
"label": "Q2",
"value": "1450000"
}, {
"label": "Q3",
"value": "1730000"
}, {
"label": "Q4",
"value": "2120000"
}]
}
}
);
fusioncharts.render();
});
</script>
</head>
<body>
<div id="chart-container">FusionCharts XT will load here!</div>
</body>
</html>Given below is the attribute used to place data values inside columns:
| Name | Description |
|---|---|
|
Set this to |
Configuring display of data values
You can display specific data values as described in this sub-section.
A column 2D chart with specific data values placed inside columns looks as below:
{
    "chart": {
        "caption": "Quarterly Revenue",
        "subcaption": "Last year",
        "xAxisName": "Quarter",
        "yAxisName": "Amount (In USD)",
        "numberPrefix": "$",
        "numDivLines": "2",
        "theme": "fint",
        "showValues": "0"
    },
    "data": [
        {
            "label": "Q1",
            "value": "1950000",
            "showValue": "1"
        },
        {
            "label": "Q2",
            "value": "1450000"
        },
        {
            "label": "Q3",
            "value": "1730000"
        },
        {
            "label": "Q4",
            "value": "2120000",
            "showValue": "1"
        }
    ],
    "trendlines": [
        {
            "line": [
                {
                    "startvalue": "1750000",
                    "color": "#1aaf5d",
                    "displayvalue": "Target - $175K",
                    "valueOnRight": "1"
                }
            ]
        }
    ]
}
<html>
<head>
<title>My first chart using FusionCharts Suite XT</title>
<script type="text/javascript" src="http://static.fusioncharts.com/code/latest/fusioncharts.js"></script>
<script type="text/javascript" src="http://static.fusioncharts.com/code/latest/themes/fusioncharts.theme.fint.js?cacheBust=56"></script>
<script type="text/javascript">
FusionCharts.ready(function(){
var fusioncharts = new FusionCharts({
type: 'column2d',
renderAt: 'chart-container',
id: 'myChart',
width: '450',
height: '300',
dataFormat: 'json',
dataSource: {
"chart": {
"caption": "Quarterly Revenue",
"subcaption": "Last year",
"xAxisName": "Quarter",
"yAxisName": "Amount (In USD)",
"numberPrefix": "$",
"numDivLines": "2",
"theme": "fint",
//Hiding all data values to show value of a specific data plot
"showValues": "0"
},
"data": [{
"label": "Q1",
"value": "1950000",
//Showing the data value for this data plot only
"showValue": "1"
}, {
"label": "Q2",
"value": "1450000"
}, {
"label": "Q3",
"value": "1730000"
}, {
"label": "Q4",
"value": "2120000",
//Showing the data value for this data plot only
"showValue": "1"
}],
"trendlines": [{
"line": [{
"startvalue": "1750000",
"color": "#1aaf5d",
"displayvalue": "Target - $175K",
"valueOnRight": "1"
}]
}]
}
}
);
fusioncharts.render();
});
</script>
</head>
<body>
<div id="chart-container">FusionCharts XT will load here!</div>
</body>
</html>Given below is the attribute used to display only specific data values:
Name |
Description |
|
Set it to |
|
Set it to |
Skipping y-axis values
If there are a large number of values to be displayed along the y-axis, FusionCharts Suite XT allows you to display only every nth y-axis value.
A column 2D chart with y-axis values skipped to render only alternate values looks as below:
{
    "chart": {
        "caption": "Quarterly Revenue",
        "subcaption": "Last year",
        "xAxisName": "Quarter",
        "yAxisName": "Amount (In USD)",
        "numberPrefix": "$",
        "yAxisValuesStep": "2",
        "theme": "fint"
    },
    "data": [
        {
            "label": "Q1",
            "value": "1950000"
        },
        {
            "label": "Q2",
            "value": "1450000"
        },
        {
            "label": "Q3",
            "value": "1730000"
        },
        {
            "label": "Q4",
            "value": "2120000"
        }
    ]
}
<html>
<head>
<title>My first chart using FusionCharts Suite XT</title>
<script type="text/javascript" src="http://static.fusioncharts.com/code/latest/fusioncharts.js"></script>
<script type="text/javascript" src="http://static.fusioncharts.com/code/latest/themes/fusioncharts.theme.fint.js?cacheBust=56"></script>
<script type="text/javascript">
FusionCharts.ready(function(){
var fusioncharts = new FusionCharts({
type: 'column2d',
renderAt: 'chart-container',
id: 'myChart',
width: '450',
height: '300',
dataFormat: 'json',
dataSource: {
"chart": {
"caption": "Quarterly Revenue",
"subcaption": "Last year",
"xAxisName": "Quarter",
"yAxisName": "Amount (In USD)",
"numberPrefix": "$",
//Y axis value step
"yAxisValuesStep": "2",
//Theme
"theme": "fint"
},
"data": [{
"label": "Q1",
"value": "1950000"
}, {
"label": "Q2",
"value": "1450000"
}, {
"label": "Q3",
"value": "1730000"
}, {
"label": "Q4",
"value": "2120000"
}]
}
}
);
fusioncharts.render();
});
</script>
</head>
<body>
<div id="chart-container">FusionCharts XT will load here!</div>
</body>
</html>Given below is the attribute used to skip y-axis values:
Attribute |
Description |
|
Setting this variable to This attribute can also assume default values based on the space available in the chart to render y-axis values, and can override the values provided to avoid overlapping of y-axis values. |
Customizing data value properties
You can customize the data value properties in terms of font, border, background, and alpha. Let us understand each of them in detail.
Font Properties
A column 2D chart with a blue color font and other customizations applied, looks as below:
{
    "chart": {
        "caption": "Quarterly Revenue",
        "subcaption": "Last year",
        "xAxisName": "Quarter",
        "yAxisName": "Amount (In USD)",
        "yaxismaxvalue": "2720000",
        "numberPrefix": "$",
        "theme": "fint",
        "placeValuesInside": "0",
        "rotateValues": "0",
        "valueFont": "Arial",
        "valueFontColor": "#6699cc",
        "valueFontSize": "12",
        "valueFontBold": "1",
        "valueFontItalic": "0"
    },
    "data": [
        {
            "label": "Q1",
            "value": "1950000"
        },
        {
            "label": "Q2",
            "value": "1450000"
        },
        {
            "label": "Q3",
            "value": "1730000"
        },
        {
            "label": "Q4",
            "value": "2120000"
        }
    ]
}
<html>
<head>
<title>My first chart using FusionCharts Suite XT</title>
<script type="text/javascript" src="http://static.fusioncharts.com/code/latest/fusioncharts.js"></script>
<script type="text/javascript" src="http://static.fusioncharts.com/code/latest/themes/fusioncharts.theme.fint.js?cacheBust=56"></script>
<script type="text/javascript">
FusionCharts.ready(function(){
var fusioncharts = new FusionCharts({
type: 'column2d',
renderAt: 'chart-container',
id: 'myChart',
width: '450',
height: '300',
dataFormat: 'json',
dataSource: {
"chart": {
"caption": "Quarterly Revenue",
"subcaption": "Last year",
"xAxisName": "Quarter",
"yAxisName": "Amount (In USD)",
"yaxismaxvalue": "2720000",
"numberPrefix": "$",
"theme": "fint",
"placeValuesInside": "0",
"rotateValues": "0",
//Changing font
"valueFont": "Arial",
//Changing font color
"valueFontColor": "#6699cc",
//Changing font size
"valueFontSize": "12",
//Changing font weight
"valueFontBold": "1",
//Changing font style
"valueFontItalic": "0"
},
"data": [{
"label": "Q1",
"value": "1950000"
}, {
"label": "Q2",
"value": "1450000"
}, {
"label": "Q3",
"value": "1730000"
}, {
"label": "Q4",
"value": "2120000"
}]
}
}
);
fusioncharts.render();
});
</script>
</head>
<body>
<div id="chart-container">FusionCharts XT will load here!</div>
</body>
</html>Given below is the list of attributes used to customize the font for data values:
Name |
Description |
|
Sets the font family for data-values, e.g. |
|
Sets the font color for data-values in hex code, eg. |
|
Specifies the data-value font size, with a range of |
|
|
|
|
|
Sets the transparency for text, background and border of the data values. Value ranges from |
Customizing data value border
A Pie 2D chart with a dashed border around the data values looks as below:
{
    "chart": {
        "theme": "fint",
        "caption": "Age group of website customers",
        "subCaption": "Last year",
        "numberPrefix": "$",
        "valueBorderColor": "#666666",
        "valueBorderAlpha": "100",
        "valueBorderPadding": "5",
        "valueBorderRadius": "6",
        "valueBorderThickness": "0.5",
        "valueBorderDashed": "1",
        "valueBorderDashLen": "4",
        "valueBorderDashGap": "2",
        "valueFontSize": "11"
    },
    "data": [
        {
            "label": "Teenage",
            "value": "1250400"
        },
        {
            "label": "Adult",
            "value": "1463300"
        },
        {
            "label": "Middle-age",
            "value": "1050700"
        },
        {
            "label": "Senior Citizen",
            "value": "491000"
        }
    ]
}
<html>
<head>
<title>My first chart using FusionCharts Suite XT</title>
<script type="text/javascript" src="http://static.fusioncharts.com/code/latest/fusioncharts.js"></script>
<script type="text/javascript" src="http://static.fusioncharts.com/code/latest/themes/fusioncharts.theme.fint.js?cacheBust=56"></script>
<script type="text/javascript">
FusionCharts.ready(function(){
var fusioncharts = new FusionCharts({
type: 'pie2d',
renderAt: 'chart-container',
id: 'myChart',
width: '450',
height: '350',
dataFormat: 'json',
dataSource: {
"chart": {
"theme": "fint",
"caption": "Age group of website customers",
"subCaption": "Last year",
"numberPrefix": "$",
//Changing border color for values
"valueBorderColor": "#666666",
//Changing border alpha
"valueBorderAlpha": "100",
//Changing border padding
"valueBorderPadding": "5",
//Changing border radius to enable rounded borders
"valueBorderRadius": "6",
//Changing border thickness
"valueBorderThickness": "0.5",
//Setting border style to dashed
"valueBorderDashed": "1",
//Setting border dash length
"valueBorderDashLen": "4",
//Setting gap between dash
"valueBorderDashGap": "2",
"valueFontSize": "11"
},
"data": [{
"label": "Teenage",
"value": "1250400"
}, {
"label": "Adult",
"value": "1463300"
}, {
"label": "Middle-age",
"value": "1050700"
}, {
"label": "Senior Citizen",
"value": "491000"
}]
}
}
);
fusioncharts.render();
});
</script>
</head>
<body>
<div id="chart-container">FusionCharts XT will load here!</div>
</body>
</html>Given below is the list of attributes used to customize the border for data values:
Name |
Description |
|
Sets the color of border around data value in hex code, eg. |
|
Sets the transparency of border of the data values. Value ranges from |
|
Sets data-value border thickness(in pixels). |
|
Sets data-value border radius(in pixels). |
|
|
|
Sets the gap between two consecutive dashes of data-value border (in pixels). |
|
Sets the length of each dash in data-value border (in pixels). |
|
Sets the value border alpha on hover |
Customizing data value background
A Pie 2D chart with background properties for data values applied looks as below:
{
    "chart": {
        "caption": "Age group of website customers",
        "subCaption": "Last year",
        "valueBgColor": "#99ccff",
        "valueBgAlpha": "30",
        "valueBgHoverAlpha": "60",
        "valueFontSize": "13",
        "theme": "fint"
    },
    "data": [
        {
            "label": "Teenage",
            "value": "1250400"
        },
        {
            "label": "Adult",
            "value": "1463300"
        },
        {
            "label": "Middle-age",
            "value": "1050700"
        },
        {
            "label": "Senior Citizen",
            "value": "491000"
        }
    ]
}
<html>
<head>
<title>My first chart using FusionCharts Suite XT</title>
<script type="text/javascript" src="http://static.fusioncharts.com/code/latest/fusioncharts.js"></script>
<script type="text/javascript" src="http://static.fusioncharts.com/code/latest/themes/fusioncharts.theme.fint.js?cacheBust=56"></script>
<script type="text/javascript">
FusionCharts.ready(function(){
var fusioncharts = new FusionCharts({
type: 'pie2d',
renderAt: 'chart-container',
id: 'myChart',
width: '450',
height: '350',
dataFormat: 'json',
dataSource: {
"chart": {
"caption": "Age group of website customers",
"subCaption": "Last year",
//Data value background properties
"valueBgColor": "#99ccff",
"valueBgAlpha": "30",
"valueBgHoverAlpha": "60",
"valueFontSize": "13",
//Theme
"theme": "fint"
},
"data": [{
"label": "Teenage",
"value": "1250400"
}, {
"label": "Adult",
"value": "1463300"
}, {
"label": "Middle-age",
"value": "1050700"
}, {
"label": "Senior Citizen",
"value": "491000"
}]
}
}
);
fusioncharts.render();
});
</script>
</head>
<body>
<div id="chart-container">FusionCharts XT will load here!</div>
</body>
</html>Given below is the list of attributes used to customize the background for data values:
Name |
Description |
|
Sets the background color of data value text in hex code, eg. |
|
Sets the transparency of text-background of the data values. Value ranges from |
|
Sets the value background alpha on hover |