Loading
Titles and Axis Names
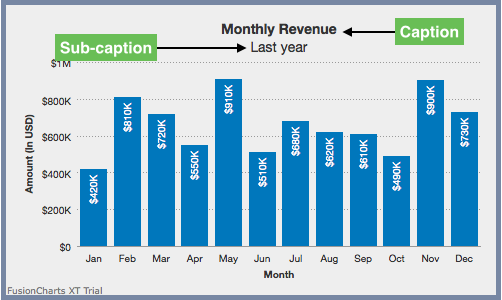
FusionCharts Suite XT allows you to add caption, sub-caption, x-axis name and y-axis name to your charts. You can configure the font properties for each of them.
The caption (also called the chart title) is the heading of your chart; a sub-caption is the text that appears just below the caption.
Cartesian charts have axes that run along the left and the bottom borders of the canvas. The x-axis runs along the bottom border of the canvas, starting at the left and ending on the right. The y-axis runs along the left border of the canvas, starting at the bottom and ending at the top of the chart. You can configure names for both the axes.
This section is divided into following parts:
Customizing chart caption and sub-caption
Setting the chart caption and sub-caption
A chart with both it’s caption and sub-caption set looks as below:
{
    "chart": {
        "caption": "Monthly Revenue",
        "subCaption": "Last year",
        "xAxisName": "Month",
        "yAxisName": "Amount(In USD)",
        "numberPrefix": "$",
        "theme": "fint"
    },
    "data": [
        {
            "label": "Jan",
            "value": "420000"
        },
        {
            "label": "Feb",
            "value": "810000"
        },
        {
            "label": "Mar",
            "value": "720000"
        },
        {
            "label": "Apr",
            "value": "550000"
        },
        {
            "label": "May",
            "value": "910000"
        },
        {
            "label": "Jun",
            "value": "510000"
        },
        {
            "label": "Jul",
            "value": "680000"
        },
        {
            "label": "Aug",
            "value": "620000"
        },
        {
            "label": "Sep",
            "value": "610000"
        },
        {
            "label": "Oct",
            "value": "490000"
        },
        {
            "label": "Nov",
            "value": "900000"
        },
        {
            "label": "Dec",
            "value": "730000"
        }
    ]
}
<html>
<head>
<title>My first chart using FusionCharts Suite XT</title>
<script type="text/javascript" src="http://static.fusioncharts.com/code/latest/fusioncharts.js"></script>
<script type="text/javascript" src="http://static.fusioncharts.com/code/latest/themes/fusioncharts.theme.fint.js?cacheBust=56"></script>
<script type="text/javascript">
FusionCharts.ready(function(){
var fusioncharts = new FusionCharts({
type: 'column2d',
renderAt: 'chart-container',
width: '500',
height: '300',
dataFormat: 'json',
dataSource: {
"chart": {
"caption": "Monthly Revenue",
"subCaption": "Last year",
"xAxisName": "Month",
"yAxisName": "Amount(In USD)",
"numberPrefix": "$",
//Theme
"theme": "fint"
},
"data": [{
"label": "Jan",
"value": "420000"
}, {
"label": "Feb",
"value": "810000"
}, {
"label": "Mar",
"value": "720000"
}, {
"label": "Apr",
"value": "550000"
}, {
"label": "May",
"value": "910000"
}, {
"label": "Jun",
"value": "510000"
}, {
"label": "Jul",
"value": "680000"
}, {
"label": "Aug",
"value": "620000"
}, {
"label": "Sep",
"value": "610000"
}, {
"label": "Oct",
"value": "490000"
}, {
"label": "Nov",
"value": "900000"
}, {
"label": "Dec",
"value": "730000"
}]
}
}
);
fusioncharts.render();
});
</script>
</head>
<body>
<div id="chart-container">FusionCharts XT will load here!</div>
</body>
</html>Mentioned below is the list of attributes used to set the chart caption and sub-caption:
Attribute Name |
Description |
|
Sets the caption of the chart to a text value |
|
Sets the sub-caption of the chart to a text value |
Customizing the caption and sub-caption font properties
You can customize the font properties of the chart’s caption and sub-caption.
A column 2D chart with the font colour set to maroon and with custom font size for caption and sub-caption looks as below:
{
    "chart": {
        "caption": "Quarterly Revenue",
        "subCaption": "Last year",
        "xAxisName": "Quarter",
        "yAxisName": "Amount (In USD)",
        "numberPrefix": "$",
        "captionFont": "Arial",
        "captionFontSize": "18",
        "captionFontColor": "#993300",
        "captionFontBold": "1",
        "subcaptionFont": "Arial",
        "subcaptionFontSize": "14",
        "subcaptionFontColor": "#993300",
        "subcaptionFontBold": "0",
        "theme": "fint"
    },
    "data": [
        {
            "label": "Q1",
            "value": "1950000"
        },
        {
            "label": "Q2",
            "value": "1450000"
        },
        {
            "label": "Q3",
            "value": "1730000"
        },
        {
            "label": "Q4",
            "value": "2120000"
        }
    ]
}
<html>
<head>
<title>My first chart using FusionCharts Suite XT</title>
<script type="text/javascript" src="http://static.fusioncharts.com/code/latest/fusioncharts.js"></script>
<script type="text/javascript" src="http://static.fusioncharts.com/code/latest/themes/fusioncharts.theme.fint.js?cacheBust=56"></script>
<script type="text/javascript">
FusionCharts.ready(function(){
var fusioncharts = new FusionCharts({
type: 'column2d',
renderAt: 'chart-container',
width: '500',
height: '300',
dataFormat: 'json',
dataSource: {
"chart": {
"caption": "Quarterly Revenue",
"subCaption": "Last year",
"xAxisName": "Quarter",
"yAxisName": "Amount (In USD)",
"numberPrefix": "$",
//Caption cosmetics
"captionFont": "Arial",
"captionFontSize": "18",
"captionFontColor": "#993300",
"captionFontBold": "1",
"subcaptionFont": "Arial",
"subcaptionFontSize": "14",
"subcaptionFontColor": "#993300",
"subcaptionFontBold": "0",
//Theme
"theme": "fint"
},
"data": [{
"label": "Q1",
"value": "1950000"
}, {
"label": "Q2",
"value": "1450000"
}, {
"label": "Q3",
"value": "1730000"
}, {
"label": "Q4",
"value": "2120000"
}]
}
}
);
fusioncharts.render();
});
</script>
</head>
<body>
<div id="chart-container">FusionCharts XT will load here!</div>
</body>
</html>Below is the list of attributes used to customize caption and sub-caption font properties:
Attribute Name |
Description |
|
Sets the caption font family, e.g. |
|
Sets the caption font color in hex code, eg. |
|
Sets the caption font size, with a range of |
|
Set caption font to bold with a value of |
|
Sets the sub-caption font family |
|
Sets the sub-caption font color in hex code, eg. |
|
Sets the sub-caption font size in pixels, with a range of |
|
Set sub-caption font to bold with a value of |
Configuring caption alignment
A column 2D chart with the caption aligned to the bottom right of the chart looks as shown below:
{
    "chart": {
        "caption": "Quarterly Revenue",
        "subCaption": "(Last year)",
        "rotateYAxisName": "0",
        "numberPrefix": "$",
        "alignCaptionWithCanvas": "1",
        "captionHorizontalPadding": "2",
        "captionOnTop": "0",
        "captionAlignment": "right",
        "theme": "fint"
    },
    "data": [
        {
            "label": "Q1",
            "value": "1950000"
        },
        {
            "label": "Q2",
            "value": "1450000"
        },
        {
            "label": "Q3",
            "value": "1730000"
        },
        {
            "label": "Q4",
            "value": "2120000"
        }
    ]
}
<html>
<head>
<title>My first chart using FusionCharts Suite XT</title>
<script type="text/javascript" src="http://static.fusioncharts.com/code/latest/fusioncharts.js"></script>
<script type="text/javascript" src="http://static.fusioncharts.com/code/latest/themes/fusioncharts.theme.fint.js?cacheBust=56"></script>
<script type="text/javascript">
FusionCharts.ready(function(){
var fusioncharts = new FusionCharts({
type: 'column2d',
renderAt: 'chart-container',
width: '500',
height: '300',
dataFormat: 'json',
dataSource: {
"chart": {
"caption": "Quarterly Revenue",
"subCaption": "(Last year)",
"rotateYAxisName": "0",
"numberPrefix": "$",
//Caption alignment attributes
"alignCaptionWithCanvas": "1",
"captionHorizontalPadding": "2",
"captionOnTop": "0",
"captionAlignment": "right",
//Theme
"theme": "fint"
},
"data": [{
"label": "Q1",
"value": "1950000"
}, {
"label": "Q2",
"value": "1450000"
}, {
"label": "Q3",
"value": "1730000"
}, {
"label": "Q4",
"value": "2120000"
}]
}
}
);
fusioncharts.render();
});
</script>
</head>
<body>
<div id="chart-container">FusionCharts XT will load here!</div>
</body>
</html>Given below is a brief description of the attributes used to configure caption alignment:
Attribute Name |
Description |
|
Sets the horizontal alignment of the caption. Valid values are |
|
Set this to |
|
Set it to |
|
Configure the padding (in pixels) from either edge if the caption is not center aligned. Will be ignored if the caption is center aligned. |
Customizing X-Axis and Y-Axis
You can configure axes names, font properties and border properties in FusionCharts Suite XT.
Setting axes names
A column 2D chart with x-axis named “Quarter” and y-axis named “Amount (In USD)” looks as below:
{
    "chart": {
        "caption": "Quarterly Revenue",
        "subCaption": "Last year",
        "xAxisName": "Quarter",
        "yAxisName": "Amount {br}(In USD)",
        "rotateYAxisName": "0",
        "numberPrefix": "$",
        "theme": "fint"
    },
    "data": [
        {
            "label": "Q1",
            "value": "1950000"
        },
        {
            "label": "Q2",
            "value": "1450000"
        },
        {
            "label": "Q3",
            "value": "1730000"
        },
        {
            "label": "Q4",
            "value": "2120000"
        }
    ]
}
<html>
<head>
<title>My first chart using FusionCharts Suite XT</title>
<script type="text/javascript" src="http://static.fusioncharts.com/code/latest/fusioncharts.js"></script>
<script type="text/javascript" src="http://static.fusioncharts.com/code/latest/themes/fusioncharts.theme.fint.js?cacheBust=56"></script>
<script type="text/javascript">
FusionCharts.ready(function(){
var fusioncharts = new FusionCharts({
type: 'column2d',
renderAt: 'chart-container',
width: '500',
height: '300',
dataFormat: 'json',
dataSource: {
"chart": {
"caption": "Quarterly Revenue",
"subCaption": "Last year",
"xAxisName": "Quarter",
"yAxisName": "Amount {br}(In USD)",
//Display y-axis title horizontally
"rotateYAxisName": "0",
"numberPrefix": "$",
//Theme
"theme": "fint"
},
"data": [{
"label": "Q1",
"value": "1950000"
}, {
"label": "Q2",
"value": "1450000"
}, {
"label": "Q3",
"value": "1730000"
}, {
"label": "Q4",
"value": "2120000"
}]
}
}
);
fusioncharts.render();
});
</script>
</head>
<body>
<div id="chart-container">FusionCharts XT will load here!</div>
</body>
</html>Given below is a description of the attributes used to configure axes names:
Attribute Name |
Description |
|
Used to set the X-axis title of the chart |
|
Used to set the Y-axis title of the chart |
Configuring the font cosmetic properties for the axes names
You can configure the cosmetic properties like font, color and size of the x-axis name using attributes described in this sub-section.
A column 2D chart with the font cosmetic properties configured looks like this:
{
    "chart": {
        "caption": "Quarterly Revenue",
        "subCaption": "Last year",
        "xAxisName": "Quarter",
        "yAxisName": "Amount (In USD)",
        "numberPrefix": "$",
        "datalabelColor": "#999999",
        "xAxisNameFont": "Arial",
        "xAxisNameFontSize": "12",
        "xAxisNameFontColor": "#993300",
        "xAxisNameFontBold": "1",
        "xAxisNameFontItalic": "1",
        "xAxisNameAlpha": "80",
        "yAxisNameFont": "Arial",
        "yAxisNameFontSize": "12",
        "yAxisNameFontColor": "#993300",
        "yAxisNameFontBold": "1",
        "yAxisNameFontItalic": "1",
        "yAxisNameAlpha": "80",
        "theme": "fint"
    },
    "data": [
        {
            "label": "Q1",
            "value": "1950000"
        },
        {
            "label": "Q2",
            "value": "1450000"
        },
        {
            "label": "Q3",
            "value": "1730000"
        },
        {
            "label": "Q4",
            "value": "2120000"
        }
    ]
}
<html>
<head>
<title>My first chart using FusionCharts Suite XT</title>
<script type="text/javascript" src="http://static.fusioncharts.com/code/latest/fusioncharts.js"></script>
<script type="text/javascript" src="http://static.fusioncharts.com/code/latest/themes/fusioncharts.theme.fint.js?cacheBust=56"></script>
<script type="text/javascript">
FusionCharts.ready(function(){
var fusioncharts = new FusionCharts({
type: 'column2d',
renderAt: 'chart-container',
width: '500',
height: '300',
dataFormat: 'json',
dataSource: {
"chart": {
"caption": "Quarterly Revenue",
"subCaption": "Last year",
"xAxisName": "Quarter",
"yAxisName": "Amount (In USD)",
"numberPrefix": "$",
"datalabelColor": "#999999",
//X-axis name cosmatics
"xAxisNameFont": "Arial",
"xAxisNameFontSize": "12",
"xAxisNameFontColor": "#993300",
"xAxisNameFontBold": "1",
"xAxisNameFontItalic": "1",
"xAxisNameAlpha": "80",
//Y-axis name cosmatiocs
"yAxisNameFont": "Arial",
"yAxisNameFontSize": "12",
"yAxisNameFontColor": "#993300",
"yAxisNameFontBold": "1",
"yAxisNameFontItalic": "1",
"yAxisNameAlpha": "80",
//Theme
"theme": "fint"
},
"data": [{
"label": "Q1",
"value": "1950000"
}, {
"label": "Q2",
"value": "1450000"
}, {
"label": "Q3",
"value": "1730000"
}, {
"label": "Q4",
"value": "2120000"
}]
}
}
);
fusioncharts.render();
});
</script>
</head>
<body>
<div id="chart-container">FusionCharts XT will load here!</div>
</body>
</html>Given below is the list of attributes used to configure fonts for the x-axis and y-axis:
Attribute Name |
Description |
|
Sets the x-axis (y-axis) font family, e.g. |
|
Sets the x-axis (y-axis) font color in hex code, e.g. |
|
Specifies the x-axis (y-axis) font size, with a range of |
|
Use |
|
Use |
Configuring the border cosmetic properties of axes names
You can configure the border cosmetic properties of names using attributes described in this sub-section.
A column 2D chart with dashed borders around the axes names looks like this:
{
    "chart": {
        "caption": "Quarterly Revenue",
        "subCaption": "Last year",
        "xAxisName": "Quarter",
        "yAxisName": "Amount (In USD)",
        "numberPrefix": "$",
        "xAxisNamePadding": "20",
        "yAxisNamePadding": "10",
        "xAxisNameBorderColor": "#6666FF",
        "xAxisNameBorderAlpha": "50",
        "xAxisNameBorderPadding": "6",
        "xAxisNameBorderRadius": "3",
        "xAxisNameBorderThickness": "2",
        "xAxisNameBorderDashed": "1",
        "xAxisNameBorderDashLen": "4",
        "xAxisNameBorderDashGap": "2",
        "yAxisNameBorderColor": "#6666FF",
        "yAxisNameBorderAlpha": "50",
        "yAxisNameBorderPadding": "6",
        "yAxisNameBorderRadius": "3",
        "yAxisNameBorderThickness": "2",
        "yAxisNameBorderDashed": "1",
        "yAxisNameBorderDashLen": "4",
        "yAxisNameBorderDashGap": "2",
        "theme": "fint"
    },
    "data": [
        {
            "label": "Q1",
            "value": "1950000"
        },
        {
            "label": "Q2",
            "value": "1450000"
        },
        {
            "label": "Q3",
            "value": "1730000"
        },
        {
            "label": "Q4",
            "value": "2120000"
        }
    ]
}
<html>
<head>
<title>My first chart using FusionCharts Suite XT</title>
<script type="text/javascript" src="http://static.fusioncharts.com/code/latest/fusioncharts.js"></script>
<script type="text/javascript" src="http://static.fusioncharts.com/code/latest/themes/fusioncharts.theme.fint.js?cacheBust=56"></script>
<script type="text/javascript">
FusionCharts.ready(function(){
var fusioncharts = new FusionCharts({
type: 'column2d',
renderAt: 'chart-container',
width: '500',
height: '300',
dataFormat: 'json',
dataSource: {
"chart": {
"caption": "Quarterly Revenue",
"subCaption": "Last year",
"xAxisName": "Quarter",
"yAxisName": "Amount (In USD)",
"numberPrefix": "$",
"xAxisNamePadding": "20",
"yAxisNamePadding": "10",
//X-axis name border properties
"xAxisNameBorderColor": "#6666FF",
"xAxisNameBorderAlpha": "50",
"xAxisNameBorderPadding": "6",
"xAxisNameBorderRadius": "3",
"xAxisNameBorderThickness": "2",
"xAxisNameBorderDashed": "1",
"xAxisNameBorderDashLen": "4",
"xAxisNameBorderDashGap": "2",
//Y-axis name border properties
"yAxisNameBorderColor": "#6666FF",
"yAxisNameBorderAlpha": "50",
"yAxisNameBorderPadding": "6",
"yAxisNameBorderRadius": "3",
"yAxisNameBorderThickness": "2",
"yAxisNameBorderDashed": "1",
"yAxisNameBorderDashLen": "4",
"yAxisNameBorderDashGap": "2",
//Theme
"theme": "fint"
},
"data": [{
"label": "Q1",
"value": "1950000"
}, {
"label": "Q2",
"value": "1450000"
}, {
"label": "Q3",
"value": "1730000"
}, {
"label": "Q4",
"value": "2120000"
}]
}
}
);
fusioncharts.render();
});
</script>
</head>
<body>
<div id="chart-container">FusionCharts XT will load here!</div>
</body>
</html>Given below is the list of attributes used for configuring axes border properties:
Attribute Name |
Description |
|
Sets the border color of x-axis (y-axis) name in hex code, e.g. |
|
Sets the transparency of x-axis (y-axis) name border. Can take values from |
|
Sets the x-axis (y-axis) name border padding (in pixels). |
|
Sets the x-axis (y-axis) name border radius (in pixels). |
|
Sets the x-axis (y-axis) name border thickness (in pixels). |
|
Set this to |
|
Sets the length of each dash in x-axis (y-axis) name border (in pixels). |
|
Sets the gap between two consecutive dashes in x-axis (y-axis) name border (in pixels). |
Configuring the font opacity and font background for axes names
A column 2D chart with the axes name background colour set to blue and high transparency configuration looks as below:
{
    "chart": {
        "caption": "Quarterly Revenue",
        "subCaption": "Last year",
        "xAxisName": "Quarter",
        "yAxisName": "Amount (In USD)",
        "yAxisNamePadding": "14",
        "numberPrefix": "$",
        "xAxisNameFont": "Arial",
        "xAxisNameFontSize": "14",
        "xAxisNameBgColor": "#3399ff",
        "xAxisNameBgAlpha": "20",
        "xAxisNameFontAlpha": "50",
        "xAxisNameBorderPadding": "10",
        "yAxisNameFont": "Arial",
        "yAxisNameFontSize": "14",
        "yAxisNameBgColor": "#3399ff",
        "yAxisNameBgAlpha": "20",
        "yAxisNameFontAlpha": "50",
        "yAxisNameBorderPadding": "10",
        "theme": "fint"
    },
    "data": [
        {
            "label": "Q1",
            "value": "1950000"
        },
        {
            "label": "Q2",
            "value": "1450000"
        },
        {
            "label": "Q3",
            "value": "1730000"
        },
        {
            "label": "Q4",
            "value": "2120000"
        }
    ]
}
<html>
<head>
<title>My first chart using FusionCharts Suite XT</title>
<script type="text/javascript" src="http://static.fusioncharts.com/code/latest/fusioncharts.js"></script>
<script type="text/javascript" src="http://static.fusioncharts.com/code/latest/themes/fusioncharts.theme.fint.js?cacheBust=56"></script>
<script type="text/javascript">
FusionCharts.ready(function(){
var fusioncharts = new FusionCharts({
type: 'column2d',
renderAt: 'chart-container',
width: '500',
height: '300',
dataFormat: 'json',
dataSource: {
"chart": {
"caption": "Quarterly Revenue",
"subCaption": "Last year",
"xAxisName": "Quarter",
"yAxisName": "Amount (In USD)",
"yAxisNamePadding": "14",
"numberPrefix": "$",
//X-axis name background properties
"xAxisNameFont": "Arial",
"xAxisNameFontSize": "14",
"xAxisNameBgColor": "#3399ff",
"xAxisNameBgAlpha": "20",
"xAxisNameFontAlpha": "50",
"xAxisNameBorderPadding": "10",
//Y-axis name background properties
"yAxisNameFont": "Arial",
"yAxisNameFontSize": "14",
"yAxisNameBgColor": "#3399ff",
"yAxisNameBgAlpha": "20",
"yAxisNameFontAlpha": "50",
"yAxisNameBorderPadding": "10",
//Theme
"theme": "fint"
},
"data": [{
"label": "Q1",
"value": "1950000"
}, {
"label": "Q2",
"value": "1450000"
}, {
"label": "Q3",
"value": "1730000"
}, {
"label": "Q4",
"value": "2120000"
}]
}
}
);
fusioncharts.render();
});
</script>
</head>
<body>
<div id="chart-container">FusionCharts XT will load here!</div>
</body>
</html>The list of attributes used to configure the background for axis names is mentioned below:
Attribute Name |
Description |
|
Sets the transparency of x-axis (y-axis) font. Can take values from |
|
Sets the background color of x-axis (y-axis) name in hex code, e.g. |
|
Sets the transparency of x-axis (y-axis) name’s background. Can take values from |
|
Sets the transparency of x-axis (y-axis) name. Can take values from |
Dual Y-Axis
Configuring font cosmetic properties for the primary and secondary y-axis names
A multi-series combination 2D chart with the primary and secondary y-axis names italicized looks as shown below:
{
    "chart": {
        "caption": "Revenues and Profits",
        "subCaption": "For last year",
        "xAxisname": "Month",
        "pYAxisName": "Amount (In USD)",
        "sYAxisName": "Profit %",
        "numberPrefix": "$",
        "sNumberSuffix": "%",
        "sYAxisMaxValue": "50",
        "pYAxisNameFont": "Arial",
        "pYAxisNameFontSize": "12",
        "pYAxisNameFontColor": "#003366",
        "pYAxisNameFontBold": "1",
        "pYAxisNameFontItalic": "1",
        "pYAxisNameAlpha": "50",
        "sYAxisNameFont": "Arial",
        "sYAxisNameFontSize": "12",
        "sYAxisNameFontColor": "#003366",
        "sYAxisNameFontBold": "1",
        "sYAxisNameFontItalic": "1",
        "sYAxisNameAlpha": "50",
        "theme": "fint"
    },
    "categories": [
        {
            "category": [
                {
                    "label": "Jan"
                },
                {
                    "label": "Feb"
                },
                {
                    "label": "Mar"
                },
                {
                    "label": "Apr"
                },
                {
                    "label": "May"
                },
                {
                    "label": "Jun"
                },
                {
                    "label": "Jul"
                },
                {
                    "label": "Aug"
                },
                {
                    "label": "Sep"
                },
                {
                    "label": "Oct"
                },
                {
                    "label": "Nov"
                },
                {
                    "label": "Dec"
                }
            ]
        }
    ],
    "dataset": [
        {
            "seriesName": "Revenues",
            "data": [
                {
                    "value": "16000"
                },
                {
                    "value": "20000"
                },
                {
                    "value": "18000"
                },
                {
                    "value": "19000"
                },
                {
                    "value": "15000"
                },
                {
                    "value": "21000"
                },
                {
                    "value": "16000"
                },
                {
                    "value": "20000"
                },
                {
                    "value": "17000"
                },
                {
                    "value": "22000"
                },
                {
                    "value": "19000"
                },
                {
                    "value": "23000"
                }
            ]
        },
        {
            "seriesName": "Profits",
            "renderAs": "area",
            "showValues": "0",
            "data": [
                {
                    "value": "4000"
                },
                {
                    "value": "5000"
                },
                {
                    "value": "3000"
                },
                {
                    "value": "4000"
                },
                {
                    "value": "1000"
                },
                {
                    "value": "7000"
                },
                {
                    "value": "1000"
                },
                {
                    "value": "4000"
                },
                {
                    "value": "1000"
                },
                {
                    "value": "8000"
                },
                {
                    "value": "2000"
                },
                {
                    "value": "7000"
                }
            ]
        },
        {
            "seriesName": "Profit %age",
            "parentYAxis": "S",
            "renderAs": "line",
            "showValues": "0",
            "data": [
                {
                    "value": "25"
                },
                {
                    "value": "25"
                },
                {
                    "value": "16.66"
                },
                {
                    "value": "21.05"
                },
                {
                    "value": "6.66"
                },
                {
                    "value": "33.33"
                },
                {
                    "value": "6.25"
                },
                {
                    "value": "25"
                },
                {
                    "value": "5.88"
                },
                {
                    "value": "36.36"
                },
                {
                    "value": "10.52"
                },
                {
                    "value": "30.43"
                }
            ]
        }
    ]
}
<html>
<head>
<title>My first chart using FusionCharts Suite XT</title>
<script type="text/javascript" src="http://static.fusioncharts.com/code/latest/fusioncharts.js"></script>
<script type="text/javascript" src="http://static.fusioncharts.com/code/latest/themes/fusioncharts.theme.fint.js?cacheBust=56"></script>
<script type="text/javascript">
FusionCharts.ready(function(){
var fusioncharts = new FusionCharts({
type: 'mscombidy2d',
renderAt: 'chart-container',
width: '500',
height: '300',
dataFormat: 'json',
dataSource: {
"chart": {
"caption": "Revenues and Profits",
"subCaption": "For last year",
"xAxisname": "Month",
"pYAxisName": "Amount (In USD)",
"sYAxisName": "Profit %",
"numberPrefix": "$",
"sNumberSuffix": "%",
"sYAxisMaxValue": "50",
//Primary Y-Axis Name font properties
"pYAxisNameFont": "Arial",
"pYAxisNameFontSize": "12",
"pYAxisNameFontColor": "#003366",
"pYAxisNameFontBold": "1",
"pYAxisNameFontItalic": "1",
"pYAxisNameAlpha": "50",
//Secondary Y-Axis Name font properties
"sYAxisNameFont": "Arial",
"sYAxisNameFontSize": "12",
"sYAxisNameFontColor": "#003366",
"sYAxisNameFontBold": "1",
"sYAxisNameFontItalic": "1",
"sYAxisNameAlpha": "50",
"theme": "fint"
},
"categories": [{
"category": [{
"label": "Jan"
}, {
"label": "Feb"
}, {
"label": "Mar"
}, {
"label": "Apr"
}, {
"label": "May"
}, {
"label": "Jun"
}, {
"label": "Jul"
}, {
"label": "Aug"
}, {
"label": "Sep"
}, {
"label": "Oct"
}, {
"label": "Nov"
}, {
"label": "Dec"
}]
}],
"dataset": [{
"seriesName": "Revenues",
"data": [{
"value": "16000"
}, {
"value": "20000"
}, {
"value": "18000"
}, {
"value": "19000"
}, {
"value": "15000"
}, {
"value": "21000"
}, {
"value": "16000"
}, {
"value": "20000"
}, {
"value": "17000"
}, {
"value": "22000"
}, {
"value": "19000"
}, {
"value": "23000"
}]
}, {
"seriesName": "Profits",
"renderAs": "area",
"showValues": "0",
"data": [{
"value": "4000"
}, {
"value": "5000"
}, {
"value": "3000"
}, {
"value": "4000"
}, {
"value": "1000"
}, {
"value": "7000"
}, {
"value": "1000"
}, {
"value": "4000"
}, {
"value": "1000"
}, {
"value": "8000"
}, {
"value": "2000"
}, {
"value": "7000"
}]
}, {
"seriesName": "Profit %age",
"parentYAxis": "S",
"renderAs": "line",
"showValues": "0",
"data": [{
"value": "25"
}, {
"value": "25"
}, {
"value": "16.66"
}, {
"value": "21.05"
}, {
"value": "6.66"
}, {
"value": "33.33"
}, {
"value": "6.25"
}, {
"value": "25"
}, {
"value": "5.88"
}, {
"value": "36.36"
}, {
"value": "10.52"
}, {
"value": "30.43"
}]
}]
}
}
);
fusioncharts.render();
});
</script>
</head>
<body>
<div id="chart-container">FusionCharts XT will load here!</div>
</body>
</html>Following is the list of attributes used to configure font properties for dual y-axes names:
Attribute Name |
Description |
|
Used to set the primary (secondary) y-axis title in dual y-axis chart |
|
Sets the primary (secondary) y-axis font family, e.g. |
|
Sets the primary (secondary) y-axis font color in hex code, e.g. |
|
Specifies the primary (secondary) y-axis font size, with a range of |
|
Use |
|
Use |
Configuring background properties for the primary and secondary y-axis names
A multi-series combination 2D chart with a blue and semi transparent background for the primary and secondary y-axis names looks as below:
{
    "chart": {
        "caption": "Revenues and Profits",
        "subCaption": "For last year",
        "xAxisname": "Month",
        "pYAxisName": "Amount (In USD)",
        "sYAxisName": "Profit %",
        "numberPrefix": "$",
        "sNumberSuffix": "%",
        "sYAxisMaxValue": "50",
        "pYAxisNameFont": "Arial",
        "pYAxisNameFontSize": "12",
        "pYAxisNameBgColor": "#3399ff",
        "pYAxisNameBgAlpha": "20",
        "pYAxisNameBorderPadding": "6",
        "pYAxisNameFontAlpha": "50",
        "sYAxisNameFont": "Arial",
        "sYAxisNameFontSize": "12",
        "sYAxisNameBgColor": "#3399ff",
        "sYAxisNameBgAlpha": "20",
        "sYAxisNameBorderPadding": "6",
        "sYAxisNameFontAlpha": "50",
        "theme": "fint"
    },
    "categories": [
        {
            "category": [
                {
                    "label": "Jan"
                },
                {
                    "label": "Feb"
                },
                {
                    "label": "Mar"
                },
                {
                    "label": "Apr"
                },
                {
                    "label": "May"
                },
                {
                    "label": "Jun"
                },
                {
                    "label": "Jul"
                },
                {
                    "label": "Aug"
                },
                {
                    "label": "Sep"
                },
                {
                    "label": "Oct"
                },
                {
                    "label": "Nov"
                },
                {
                    "label": "Dec"
                }
            ]
        }
    ],
    "dataset": [
        {
            "seriesName": "Revenues",
            "data": [
                {
                    "value": "16000"
                },
                {
                    "value": "20000"
                },
                {
                    "value": "18000"
                },
                {
                    "value": "19000"
                },
                {
                    "value": "15000"
                },
                {
                    "value": "21000"
                },
                {
                    "value": "16000"
                },
                {
                    "value": "20000"
                },
                {
                    "value": "17000"
                },
                {
                    "value": "22000"
                },
                {
                    "value": "19000"
                },
                {
                    "value": "23000"
                }
            ]
        },
        {
            "seriesName": "Profits",
            "renderAs": "area",
            "showValues": "0",
            "data": [
                {
                    "value": "4000"
                },
                {
                    "value": "5000"
                },
                {
                    "value": "3000"
                },
                {
                    "value": "4000"
                },
                {
                    "value": "1000"
                },
                {
                    "value": "7000"
                },
                {
                    "value": "1000"
                },
                {
                    "value": "4000"
                },
                {
                    "value": "1000"
                },
                {
                    "value": "8000"
                },
                {
                    "value": "2000"
                },
                {
                    "value": "7000"
                }
            ]
        },
        {
            "seriesName": "Profit %age",
            "parentYAxis": "S",
            "renderAs": "line",
            "showValues": "0",
            "data": [
                {
                    "value": "25"
                },
                {
                    "value": "25"
                },
                {
                    "value": "16.66"
                },
                {
                    "value": "21.05"
                },
                {
                    "value": "6.66"
                },
                {
                    "value": "33.33"
                },
                {
                    "value": "6.25"
                },
                {
                    "value": "25"
                },
                {
                    "value": "5.88"
                },
                {
                    "value": "36.36"
                },
                {
                    "value": "10.52"
                },
                {
                    "value": "30.43"
                }
            ]
        }
    ]
}
<html>
<head>
<title>My first chart using FusionCharts Suite XT</title>
<script type="text/javascript" src="http://static.fusioncharts.com/code/latest/fusioncharts.js"></script>
<script type="text/javascript" src="http://static.fusioncharts.com/code/latest/themes/fusioncharts.theme.fint.js?cacheBust=56"></script>
<script type="text/javascript">
FusionCharts.ready(function(){
var fusioncharts = new FusionCharts({
type: 'mscombidy2d',
renderAt: 'chart-container',
width: '500',
height: '300',
dataFormat: 'json',
dataSource: {
"chart": {
"caption": "Revenues and Profits",
"subCaption": "For last year",
"xAxisname": "Month",
"pYAxisName": "Amount (In USD)",
"sYAxisName": "Profit %",
"numberPrefix": "$",
"sNumberSuffix": "%",
"sYAxisMaxValue": "50",
//Primary Y-Axis font background cosmatics
"pYAxisNameFont": "Arial",
"pYAxisNameFontSize": "12",
"pYAxisNameBgColor": "#3399ff",
"pYAxisNameBgAlpha": "20",
"pYAxisNameBorderPadding": "6",
"pYAxisNameFontAlpha": "50",
//Secondary Y-Axis font background cosmatics
"sYAxisNameFont": "Arial",
"sYAxisNameFontSize": "12",
"sYAxisNameBgColor": "#3399ff",
"sYAxisNameBgAlpha": "20",
"sYAxisNameBorderPadding": "6",
"sYAxisNameFontAlpha": "50",
//Theme
"theme": "fint"
},
"categories": [{
"category": [{
"label": "Jan"
}, {
"label": "Feb"
}, {
"label": "Mar"
}, {
"label": "Apr"
}, {
"label": "May"
}, {
"label": "Jun"
}, {
"label": "Jul"
}, {
"label": "Aug"
}, {
"label": "Sep"
}, {
"label": "Oct"
}, {
"label": "Nov"
}, {
"label": "Dec"
}]
}],
"dataset": [{
"seriesName": "Revenues",
"data": [{
"value": "16000"
}, {
"value": "20000"
}, {
"value": "18000"
}, {
"value": "19000"
}, {
"value": "15000"
}, {
"value": "21000"
}, {
"value": "16000"
}, {
"value": "20000"
}, {
"value": "17000"
}, {
"value": "22000"
}, {
"value": "19000"
}, {
"value": "23000"
}]
}, {
"seriesName": "Profits",
"renderAs": "area",
"showValues": "0",
"data": [{
"value": "4000"
}, {
"value": "5000"
}, {
"value": "3000"
}, {
"value": "4000"
}, {
"value": "1000"
}, {
"value": "7000"
}, {
"value": "1000"
}, {
"value": "4000"
}, {
"value": "1000"
}, {
"value": "8000"
}, {
"value": "2000"
}, {
"value": "7000"
}]
}, {
"seriesName": "Profit %age",
"parentYAxis": "S",
"renderAs": "line",
"showValues": "0",
"data": [{
"value": "25"
}, {
"value": "25"
}, {
"value": "16.66"
}, {
"value": "21.05"
}, {
"value": "6.66"
}, {
"value": "33.33"
}, {
"value": "6.25"
}, {
"value": "25"
}, {
"value": "5.88"
}, {
"value": "36.36"
}, {
"value": "10.52"
}, {
"value": "30.43"
}]
}]
}
}
);
fusioncharts.render();
});
</script>
</head>
<body>
<div id="chart-container">FusionCharts XT will load here!</div>
</body>
</html>Given below is the list of attributes used to configure background for dual y-axes:
Attribute Name |
Description |
|
Sets the transparency of primary (secondary) y-axis font. Can take values from |
|
Sets the background color of primary (secondary) y-axis name in hex code, e.g. |
|
Sets the transparency of primary (secondary) y-axis background. Can take values from |
Configuring the border cosmetic properties for the primary and secondary y-axis names
A Multi-series combination 2D chart with a purple coloured dashed border around the primary and secondary y-axis names looks as below:
{
    "chart": {
        "caption": "Revenues and Profits",
        "subCaption": "For last year",
        "xAxisname": "Month",
        "pYAxisName": "Amount (In USD)",
        "sYAxisName": "Profit %age",
        "numberPrefix": "$",
        "sNumberSuffix": "%",
        "sYAxisMaxValue": "50",
        "pYAxisNameBorderColor": "#6666FF",
        "pYAxisNameBorderAlpha": "50",
        "pYAxisNameBorderPadding": "6",
        "pYAxisNameBorderRadius": "0",
        "pYAxisNameBorderThickness": "1",
        "pYAxisNameBorderDashed": "1",
        "pYAxisNameBorderDashLen": "4",
        "pYAxisNameBorderDashGap": "2",
        "sYAxisNameBorderColor": "#6666FF",
        "sYAxisNameBorderAlpha": "50",
        "sYAxisNameBorderPadding": "6",
        "sYAxisNameBorderRadius": "0",
        "sYAxisNameBorderThickness": "1",
        "sYAxisNameBorderDashed": "1",
        "sYAxisNameBorderDashLen": "4",
        "sYAxisNameBorderDashGap": "2",
        "theme": "fint"
    },
    "categories": [
        {
            "category": [
                {
                    "label": "Jan"
                },
                {
                    "label": "Feb"
                },
                {
                    "label": "Mar"
                },
                {
                    "label": "Apr"
                },
                {
                    "label": "May"
                },
                {
                    "label": "Jun"
                },
                {
                    "label": "Jul"
                },
                {
                    "label": "Aug"
                },
                {
                    "label": "Sep"
                },
                {
                    "label": "Oct"
                },
                {
                    "label": "Nov"
                },
                {
                    "label": "Dec"
                }
            ]
        }
    ],
    "dataset": [
        {
            "seriesName": "Revenues",
            "data": [
                {
                    "value": "16000"
                },
                {
                    "value": "20000"
                },
                {
                    "value": "18000"
                },
                {
                    "value": "19000"
                },
                {
                    "value": "15000"
                },
                {
                    "value": "21000"
                },
                {
                    "value": "16000"
                },
                {
                    "value": "20000"
                },
                {
                    "value": "17000"
                },
                {
                    "value": "22000"
                },
                {
                    "value": "19000"
                },
                {
                    "value": "23000"
                }
            ]
        },
        {
            "seriesName": "Profits",
            "renderAs": "area",
            "showValues": "0",
            "data": [
                {
                    "value": "4000"
                },
                {
                    "value": "5000"
                },
                {
                    "value": "3000"
                },
                {
                    "value": "4000"
                },
                {
                    "value": "1000"
                },
                {
                    "value": "7000"
                },
                {
                    "value": "1000"
                },
                {
                    "value": "4000"
                },
                {
                    "value": "1000"
                },
                {
                    "value": "8000"
                },
                {
                    "value": "2000"
                },
                {
                    "value": "7000"
                }
            ]
        },
        {
            "seriesName": "Profit %age",
            "parentYAxis": "S",
            "renderAs": "line",
            "showValues": "0",
            "data": [
                {
                    "value": "25"
                },
                {
                    "value": "25"
                },
                {
                    "value": "16.66"
                },
                {
                    "value": "21.05"
                },
                {
                    "value": "6.66"
                },
                {
                    "value": "33.33"
                },
                {
                    "value": "6.25"
                },
                {
                    "value": "25"
                },
                {
                    "value": "5.88"
                },
                {
                    "value": "36.36"
                },
                {
                    "value": "10.52"
                },
                {
                    "value": "30.43"
                }
            ]
        }
    ]
}
<html>
<head>
<title>My first chart using FusionCharts Suite XT</title>
<script type="text/javascript" src="http://static.fusioncharts.com/code/latest/fusioncharts.js"></script>
<script type="text/javascript" src="http://static.fusioncharts.com/code/latest/themes/fusioncharts.theme.fint.js?cacheBust=56"></script>
<script type="text/javascript">
FusionCharts.ready(function(){
var fusioncharts = new FusionCharts({
type: 'mscombidy2d',
renderAt: 'chart-container',
width: '500',
height: '300',
dataFormat: 'json',
dataSource: {
"chart": {
"caption": "Revenues and Profits",
"subCaption": "For last year",
"xAxisname": "Month",
"pYAxisName": "Amount (In USD)",
"sYAxisName": "Profit %age",
"numberPrefix": "$",
"sNumberSuffix": "%",
"sYAxisMaxValue": "50",
//Primary Y-Axis border cosmatics
"pYAxisNameBorderColor": "#6666FF",
"pYAxisNameBorderAlpha": "50",
"pYAxisNameBorderPadding": "6",
"pYAxisNameBorderRadius": "0",
"pYAxisNameBorderThickness": "1",
"pYAxisNameBorderDashed": "1",
"pYAxisNameBorderDashLen": "4",
"pYAxisNameBorderDashGap": "2",
//Secondary Y-Axis border cosmatics
"sYAxisNameBorderColor": "#6666FF",
"sYAxisNameBorderAlpha": "50",
"sYAxisNameBorderPadding": "6",
"sYAxisNameBorderRadius": "0",
"sYAxisNameBorderThickness": "1",
"sYAxisNameBorderDashed": "1",
"sYAxisNameBorderDashLen": "4",
"sYAxisNameBorderDashGap": "2",
//Theme
"theme": "fint"
},
"categories": [{
"category": [{
"label": "Jan"
}, {
"label": "Feb"
}, {
"label": "Mar"
}, {
"label": "Apr"
}, {
"label": "May"
}, {
"label": "Jun"
}, {
"label": "Jul"
}, {
"label": "Aug"
}, {
"label": "Sep"
}, {
"label": "Oct"
}, {
"label": "Nov"
}, {
"label": "Dec"
}]
}],
"dataset": [{
"seriesName": "Revenues",
"data": [{
"value": "16000"
}, {
"value": "20000"
}, {
"value": "18000"
}, {
"value": "19000"
}, {
"value": "15000"
}, {
"value": "21000"
}, {
"value": "16000"
}, {
"value": "20000"
}, {
"value": "17000"
}, {
"value": "22000"
}, {
"value": "19000"
}, {
"value": "23000"
}]
}, {
"seriesName": "Profits",
"renderAs": "area",
"showValues": "0",
"data": [{
"value": "4000"
}, {
"value": "5000"
}, {
"value": "3000"
}, {
"value": "4000"
}, {
"value": "1000"
}, {
"value": "7000"
}, {
"value": "1000"
}, {
"value": "4000"
}, {
"value": "1000"
}, {
"value": "8000"
}, {
"value": "2000"
}, {
"value": "7000"
}]
}, {
"seriesName": "Profit %age",
"parentYAxis": "S",
"renderAs": "line",
"showValues": "0",
"data": [{
"value": "25"
}, {
"value": "25"
}, {
"value": "16.66"
}, {
"value": "21.05"
}, {
"value": "6.66"
}, {
"value": "33.33"
}, {
"value": "6.25"
}, {
"value": "25"
}, {
"value": "5.88"
}, {
"value": "36.36"
}, {
"value": "10.52"
}, {
"value": "30.43"
}]
}]
}
}
);
fusioncharts.render();
});
</script>
</head>
<body>
<div id="chart-container">FusionCharts XT will load here!</div>
</body>
</html>Given below is the list of attributes used to configure border properties for primary and secondary y-axes names:
Attribute Name |
Description |
|
Sets the border color of primary (secondary) y-axis name in hex code, e.g. |
|
Sets the transparency of primary (secondary) y-axis border. Can take values from |
|
Sets the primary (secondary) y-axis name border padding (in pixels). |
|
Sets the primary (secondary) y-axis name border radius in pixels (in pixels). |
|
Sets the primary (secondary) y-axis name border thickness (in pixels). |
|
Set to |
|
Sets the length (in pixels) of each dash in primary (secondary) y-axis name border. |
|
Sets the gap between two consecutive dashes in primary (secondary) y-axis name border (in pixels). |