Loading
Introduction to Heat Map Chart
A heat map chart is a specialized chart that uses colors to represent data values in a table. It is mostly used to plot large and complex data.
In this section, you will be introduced to the:
Basics of Heat Map Charts
You can use the heat map chart to plot data like employee attendance, a periodic table, tracking investments in the stock market, comparing the performance of different companies, etc. You can set different colors for different levels of data. For example, you can use the heat map chart to plot the employee attendance and use the red, yellow, blue and green color to indicate a bad, average, good, and excellent, respectively, percentage of employee attendance. When the chart is rendered the four levels can be easily distinguished by their respective colors.
Key Features
Salient features of the heat map chart include:
-
Data is arranged in a tabular format containing a finite number of rows and columns
-
Both numeric and non-numeric data can be plotted
-
A solid color or a gradient color can be used to display a range of values
-
Interactive legend is used to show or hide data plots
-
Any data which is not mapped by the defined color range remains hidden
-
There are two types of legends : icon legend and gradient legend
Types of Heat Map Charts
FusionCharts Suite XT includes two types of heat map charts:
-
Numeric heat map chart: It is used to plot numeric data.
-
Category-based heat map chart: It is used to plot non-numeric data.
Numeric Heat Map Chart
A simple numeric heat map chart looks like this:
{
    "chart": {
        "caption": "Top Smartphone Ratings",
        "subcaption": "By Features",
        "xAxisName": "Features",
        "yAxisName": "Model",
        "showplotborder": "1",
        "xAxisLabelsOnTop": "1",
        "plottooltext": "<div id='nameDiv' style='font-size: 12px; border-bottom: 1px dashed #666666; font-weight:bold; padding-bottom: 3px; margin-bottom: 5px; display: inline-block; color: #888888;' >$rowLabel :</div>{br}Rating : <b>$dataValue</b>{br}$columnLabel : <b>$tlLabel</b>{br}<b>$trLabel</b>",
        "baseFontColor": "#333333",
        "baseFont": "Helvetica Neue,Arial",
        "toolTipBorderRadius": "2",
        "toolTipPadding": "5",
        "theme": "fint"
    },
    "dataset": [
        {
            "data": [
                {
                    "rowid": "Samsung Galaxy S5",
                    "columnid": "Processor",
                    "value": "8.7",
                    "tllabel": "Quad Core 2.5 GHz",
                    "trlabel": "OS : Android 4.4 Kitkat"
                },
                {
                    "rowid": "Samsung Galaxy S5",
                    "columnid": "Screen Size",
                    "value": "8.5",
                    "tllabel": "5.1 inch",
                    "trlabel": "AMOLED screen"
                },
                {
                    "rowid": "Samsung Galaxy S5",
                    "columnid": "Price",
                    "value": "9.3",
                    "tllabel": "$600"
                },
                {
                    "rowid": "Samsung Galaxy S5",
                    "columnid": "Battery Backup",
                    "value": "9.7",
                    "tllabel": "29 Hrs",
                    "trlabel": "Battery : 2800 MAH"
                },
                {
                    "rowid": "Samsung Galaxy S5",
                    "columnid": "Camera",
                    "value": "8",
                    "tllabel": "16 MP",
                    "trlabel": "Front Camera : 2.1 MP"
                },
                {
                    "rowid": "HTC One (M8)",
                    "columnid": "Processor",
                    "value": "9.2",
                    "tllabel": "Quad Core 2.3 GHz",
                    "trlabel": "OS : Android 4.4 Kitkat"
                },
                {
                    "rowid": "HTC One (M8)",
                    "columnid": "Screen Size",
                    "value": "8.3",
                    "tllabel": "5 inch",
                    "trlabel": "LCD screen"
                },
                {
                    "rowid": "HTC One (M8)",
                    "columnid": "Price",
                    "value": "7.3",
                    "tllabel": "$600"
                },
                {
                    "rowid": "HTC One (M8)",
                    "columnid": "Battery Backup",
                    "value": "8.8",
                    "tllabel": "20 Hrs",
                    "trlabel": "Battery : 2600 MAH"
                },
                {
                    "rowid": "HTC One (M8)",
                    "columnid": "Camera",
                    "value": "8.7",
                    "tllabel": "4 MP",
                    "trlabel": "Front Camera : 5 MP"
                },
                {
                    "rowid": "Apple iPhone 5S",
                    "columnid": "Processor",
                    "value": "9.1",
                    "tllabel": "Dual Core",
                    "trlabel": "OS : iOS 7"
                },
                {
                    "rowid": "Apple iPhone 5S",
                    "columnid": "Screen Size",
                    "value": "8.6",
                    "tllabel": "4 inch",
                    "trlabel": "Retina LCD screen"
                },
                {
                    "rowid": "Apple iPhone 5S",
                    "columnid": "Price",
                    "value": "7.2",
                    "tllabel": "$649"
                },
                {
                    "rowid": "Apple iPhone 5S",
                    "columnid": "Battery Backup",
                    "value": "8.4",
                    "tllabel": "10 Hrs",
                    "trlabel": "Battery : 1560 MAH"
                },
                {
                    "rowid": "Apple iPhone 5S",
                    "columnid": "Camera",
                    "value": "9.5",
                    "tllabel": "8 MP",
                    "trlabel": "Front Camera : 1.2 MP"
                },
                {
                    "rowid": "Nokia Lumia 1520",
                    "columnid": "Processor",
                    "value": "8.8",
                    "tllabel": "Quad Core 2.2 GHz",
                    "trlabel": "OS: Windows Phone 8"
                },
                {
                    "rowid": "Nokia Lumia 1520",
                    "columnid": "Screen Size",
                    "value": "9.1",
                    "tllabel": "6 inch",
                    "trlabel": "LCD screen"
                },
                {
                    "rowid": "Nokia Lumia 1520",
                    "columnid": "Price",
                    "value": "9.7",
                    "tllabel": "$470"
                },
                {
                    "rowid": "Nokia Lumia 1520",
                    "columnid": "Battery Backup",
                    "value": "9.2",
                    "tllabel": "27 Hrs",
                    "trlabel": "Battery : 3400 MAH"
                },
                {
                    "rowid": "Nokia Lumia 1520",
                    "columnid": "Camera",
                    "value": "8.1",
                    "tllabel": "20MP",
                    "trlabel": "Front Camera : 1.2 MP"
                }
            ]
        }
    ],
    "colorrange": {
        "gradient": "0",
        "minvalue": "0",
        "code": "E24B1A",
        "startlabel": "Poor",
        "endlabel": "Good",
        "color": [
            {
                "code": "E24B1A",
                "minvalue": "1",
                "maxvalue": "5",
                "label": "Bad"
            },
            {
                "code": "F6BC33",
                "minvalue": "5",
                "maxvalue": "8.5",
                "label": "Average"
            },
            {
                "code": "6DA81E",
                "minvalue": "8.5",
                "maxvalue": "10",
                "label": "Good"
            }
        ]
    }
}
<html>
<head>
<title>My first chart using FusionCharts Suite XT</title>
<script type="text/javascript" src="http://static.fusioncharts.com/code/latest/fusioncharts.js"></script>
<script type="text/javascript" src="http://static.fusioncharts.com/code/latest/themes/fusioncharts.theme.fint.js?cacheBust=56"></script>
<script type="text/javascript">
FusionCharts.ready(function(){
var fusioncharts = new FusionCharts({
type: 'heatmap',
renderAt: 'chart-container',
width: '550',
height: '270',
dataFormat: 'json',
dataSource: {
"chart": {
"caption": "Top Smartphone Ratings",
"subcaption": "By Features",
"xAxisName": "Features",
"yAxisName": "Model",
"showplotborder": "1",
"xAxisLabelsOnTop": "1",
"plottooltext": "<div id='nameDiv' style='font-size: 12px; border-bottom: 1px dashed #666666; font-weight:bold; padding-bottom: 3px; margin-bottom: 5px; display: inline-block; color: #888888;' >$rowLabel :</div>{br}Rating : <b>$dataValue</b>{br}$columnLabel : <b>$tlLabel</b>{br}<b>$trLabel</b>",
//Cosmetics
"baseFontColor": "#333333",
"baseFont": "Helvetica Neue,Arial",
"toolTipBorderRadius": "2",
"toolTipPadding": "5",
"theme": "fint"
},
"dataset": [{
"data": [{
"rowid": "Samsung Galaxy S5",
"columnid": "Processor",
"value": "8.7",
"tllabel": "Quad Core 2.5 GHz",
"trlabel": "OS : Android 4.4 Kitkat"
}, {
"rowid": "Samsung Galaxy S5",
"columnid": "Screen Size",
"value": "8.5",
"tllabel": "5.1 inch",
"trlabel": "AMOLED screen"
}, {
"rowid": "Samsung Galaxy S5",
"columnid": "Price",
"value": "9.3",
"tllabel": "$600"
}, {
"rowid": "Samsung Galaxy S5",
"columnid": "Battery Backup",
"value": "9.7",
"tllabel": "29 Hrs",
"trlabel": "Battery : 2800 MAH"
}, {
"rowid": "Samsung Galaxy S5",
"columnid": "Camera",
"value": "8",
"tllabel": "16 MP",
"trlabel": "Front Camera : 2.1 MP"
}, {
"rowid": "HTC One (M8)",
"columnid": "Processor",
"value": "9.2",
"tllabel": "Quad Core 2.3 GHz",
"trlabel": "OS : Android 4.4 Kitkat"
}, {
"rowid": "HTC One (M8)",
"columnid": "Screen Size",
"value": "8.3",
"tllabel": "5 inch",
"trlabel": "LCD screen"
}, {
"rowid": "HTC One (M8)",
"columnid": "Price",
"value": "7.3",
"tllabel": "$600"
}, {
"rowid": "HTC One (M8)",
"columnid": "Battery Backup",
"value": "8.8",
"tllabel": "20 Hrs",
"trlabel": "Battery : 2600 MAH"
}, {
"rowid": "HTC One (M8)",
"columnid": "Camera",
"value": "8.7",
"tllabel": "4 MP",
"trlabel": "Front Camera : 5 MP"
}, {
"rowid": "Apple iPhone 5S",
"columnid": "Processor",
"value": "9.1",
"tllabel": "Dual Core",
"trlabel": "OS : iOS 7"
}, {
"rowid": "Apple iPhone 5S",
"columnid": "Screen Size",
"value": "8.6",
"tllabel": "4 inch",
"trlabel": "Retina LCD screen"
}, {
"rowid": "Apple iPhone 5S",
"columnid": "Price",
"value": "7.2",
"tllabel": "$649"
}, {
"rowid": "Apple iPhone 5S",
"columnid": "Battery Backup",
"value": "8.4",
"tllabel": "10 Hrs",
"trlabel": "Battery : 1560 MAH"
}, {
"rowid": "Apple iPhone 5S",
"columnid": "Camera",
"value": "9.5",
"tllabel": "8 MP",
"trlabel": "Front Camera : 1.2 MP"
}, {
"rowid": "Nokia Lumia 1520",
"columnid": "Processor",
"value": "8.8",
"tllabel": "Quad Core 2.2 GHz",
"trlabel": "OS: Windows Phone 8"
}, {
"rowid": "Nokia Lumia 1520",
"columnid": "Screen Size",
"value": "9.1",
"tllabel": "6 inch",
"trlabel": "LCD screen"
}, {
"rowid": "Nokia Lumia 1520",
"columnid": "Price",
"value": "9.7",
"tllabel": "$470"
}, {
"rowid": "Nokia Lumia 1520",
"columnid": "Battery Backup",
"value": "9.2",
"tllabel": "27 Hrs",
"trlabel": "Battery : 3400 MAH"
}, {
"rowid": "Nokia Lumia 1520",
"columnid": "Camera",
"value": "8.1",
"tllabel": "20MP",
"trlabel": "Front Camera : 1.2 MP"
}]
}],
"colorrange": {
"gradient": "0",
"minvalue": "0",
"code": "E24B1A",
"startlabel": "Poor",
"endlabel": "Good",
"color": [{
"code": "E24B1A",
"minvalue": "1",
"maxvalue": "5",
"label": "Bad"
}, {
"code": "F6BC33",
"minvalue": "5",
"maxvalue": "8.5",
"label": "Average"
}, {
"code": "6DA81E",
"minvalue": "8.5",
"maxvalue": "10",
"label": "Good"
}]
}
}
}
);
fusioncharts.render();
});
</script>
</head>
<body>
<div id="chart-container">FusionCharts XT will load here!</div>
</body>
</html>Category-based Heat Map Chart
A simple category-based heat map chart looks like this:
{
    "chart": {
        "theme": "fint",
        "caption": "Top 4 US Cities",
        "subcaption": "Average temperature (°F) in seasons (2013-14)",
        "xAxisName": "Seasons",
        "yAxisName": "Cities",
        "showPlotBorder": "1",
        "mapByCategory": "1"
    },
    "rows": {
        "row": [
            {
                "id": "NY",
                "label": "New York"
            },
            {
                "id": "LA",
                "label": "Los Angeles"
            },
            {
                "id": "CH",
                "label": "Chicago"
            },
            {
                "id": "HO",
                "label": "Houston"
            }
        ]
    },
    "columns": {
        "column": [
            {
                "id": "wI",
                "label": "Winter"
            },
            {
                "id": "SU",
                "label": "Summer"
            },
            {
                "id": "SP",
                "label": "Spring"
            },
            {
                "id": "AU",
                "label": "Autumn"
            }
        ]
    },
    "dataset": [
        {
            "data": [
                {
                    "rowid": "LA",
                    "columnid": "WI",
                    "displayValue": "60.10",
                    "colorRangeLabel": "Warm"
                },
                {
                    "rowid": "LA",
                    "columnid": "SP",
                    "displayValue": "64.5",
                    "colorRangeLabel": "Warm"
                },
                {
                    "rowid": "LA",
                    "columnid": "SU",
                    "displayValue": "68.2",
                    "colorRangeLabel": "Warm"
                },
                {
                    "rowid": "LA",
                    "columnid": "AU",
                    "displayValue": "65.7",
                    "colorRangeLabel": "Warm"
                },
                {
                    "rowid": "NY",
                    "columnid": "WI",
                    "displayValue": "33.7",
                    "colorRangeLabel": "Freezing"
                },
                {
                    "rowid": "NY",
                    "columnid": "SP",
                    "displayValue": "57.8",
                    "colorRangeLabel": "Warm"
                },
                {
                    "rowid": "NY",
                    "columnid": "SU",
                    "displayValue": "74.49",
                    "colorRangeLabel": "Hot"
                },
                {
                    "rowid": "NY",
                    "columnid": "AU",
                    "displayValue": "57.6",
                    "colorRangeLabel": "Warm"
                },
                {
                    "rowid": "CH",
                    "columnid": "WI",
                    "displayValue": "22.89",
                    "colorRangeLabel": "Freezing"
                },
                {
                    "rowid": "CH",
                    "columnid": "SP",
                    "displayValue": "55.7",
                    "colorRangeLabel": "Warm"
                },
                {
                    "rowid": "CH",
                    "columnid": "SU",
                    "displayValue": "72.2",
                    "colorRangeLabel": "Hot"
                },
                {
                    "rowid": "CH",
                    "columnid": "AU",
                    "displayValue": "51.6",
                    "colorRangeLabel": "Warm"
                },
                {
                    "rowid": "HO",
                    "columnid": "WI",
                    "displayValue": "53.0",
                    "colorRangeLabel": "Warm"
                },
                {
                    "rowid": "HO",
                    "columnid": "SP",
                    "displayValue": "72.7",
                    "colorRangeLabel": "Hot"
                },
                {
                    "rowid": "HO",
                    "columnid": "SU",
                    "displayValue": "83.3",
                    "colorRangeLabel": "Hot"
                },
                {
                    "rowid": "HO",
                    "columnid": "AU",
                    "displayValue": "53.0",
                    "colorRangeLabel": "Warm"
                }
            ]
        }
    ],
    "colorRange": {
        "gradient": "0",
        "color": [
            {
                "code": "#6da81e",
                "minValue": "0",
                "maxValue": "50",
                "label": "Freezing"
            },
            {
                "code": "#f6bc33",
                "minValue": "50",
                "maxValue": "70",
                "label": "Warm"
            },
            {
                "code": "#e24b1a",
                "minValue": "70",
                "maxValue": "85",
                "label": "Hot"
            }
        ]
    }
}
<html>
<head>
<title>My first chart using FusionCharts Suite XT</title>
<script type="text/javascript" src="http://static.fusioncharts.com/code/latest/fusioncharts.js"></script>
<script type="text/javascript" src="http://static.fusioncharts.com/code/latest/themes/fusioncharts.theme.fint.js?cacheBust=56"></script>
<script type="text/javascript">
FusionCharts.ready(function(){
var fusioncharts = new FusionCharts({
type: 'heatmap',
renderAt: 'chart-container',
width: '550',
height: '300',
dataFormat: 'json',
dataSource: {
"chart": {
"theme": "fint",
"caption": "Top 4 US Cities",
"subcaption": "Average temperature (°F) in seasons (2013-14)",
"xAxisName": "Seasons",
"yAxisName": "Cities",
"showPlotBorder": "1",
"mapByCategory": "1"
},
"rows": {
"row": [{
"id": "NY",
"label": "New York"
}, {
"id": "LA",
"label": "Los Angeles"
}, {
"id": "CH",
"label": "Chicago"
}, {
"id": "HO",
"label": "Houston"
}]
},
"columns": {
"column": [{
"id": "wI",
"label": "Winter"
}, {
"id": "SU",
"label": "Summer"
}, {
"id": "SP",
"label": "Spring"
}, {
"id": "AU",
"label": "Autumn"
}]
},
"dataset": [{
"data": [{
"rowid": "LA",
"columnid": "WI",
"displayValue": "60.10",
"colorRangeLabel": "Warm"
}, {
"rowid": "LA",
"columnid": "SP",
"displayValue": "64.5",
"colorRangeLabel": "Warm"
}, {
"rowid": "LA",
"columnid": "SU",
"displayValue": "68.2",
"colorRangeLabel": "Warm"
}, {
"rowid": "LA",
"columnid": "AU",
"displayValue": "65.7",
"colorRangeLabel": "Warm"
}, {
"rowid": "NY",
"columnid": "WI",
"displayValue": "33.7",
"colorRangeLabel": "Freezing"
}, {
"rowid": "NY",
"columnid": "SP",
"displayValue": "57.8",
"colorRangeLabel": "Warm"
}, {
"rowid": "NY",
"columnid": "SU",
"displayValue": "74.49",
"colorRangeLabel": "Hot"
}, {
"rowid": "NY",
"columnid": "AU",
"displayValue": "57.6",
"colorRangeLabel": "Warm"
}, {
"rowid": "CH",
"columnid": "WI",
"displayValue": "22.89",
"colorRangeLabel": "Freezing"
}, {
"rowid": "CH",
"columnid": "SP",
"displayValue": "55.7",
"colorRangeLabel": "Warm"
}, {
"rowid": "CH",
"columnid": "SU",
"displayValue": "72.2",
"colorRangeLabel": "Hot"
}, {
"rowid": "CH",
"columnid": "AU",
"displayValue": "51.6",
"colorRangeLabel": "Warm"
}, {
"rowid": "HO",
"columnid": "WI",
"displayValue": "53.0",
"colorRangeLabel": "Warm"
}, {
"rowid": "HO",
"columnid": "SP",
"displayValue": "72.7",
"colorRangeLabel": "Hot"
}, {
"rowid": "HO",
"columnid": "SU",
"displayValue": "83.3",
"colorRangeLabel": "Hot"
}, {
"rowid": "HO",
"columnid": "AU",
"displayValue": "53.0",
"colorRangeLabel": "Warm"
}]
}],
"colorRange": {
"gradient": "0",
"color": [{
"code": "#6da81e",
"minValue": "0",
"maxValue": "50",
"label": "Freezing"
}, {
"code": "#f6bc33",
"minValue": "50",
"maxValue": "70",
"label": "Warm"
}, {
"code": "#e24b1a",
"minValue": "70",
"maxValue": "85",
"label": "Hot"
}]
}
}
}
);
fusioncharts.render();
});
</script>
</head>
<body>
<div id="chart-container">FusionCharts XT will load here!</div>
</body>
</html>Legends in Heat Map Charts
Heat map charts allow you to display two types of legends:
-
Gradient legend
-
Icon legend
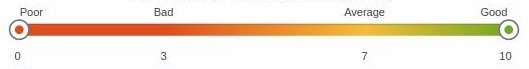
Gradient Legend
A simple gradient legend looks as shown in the image below:
Icon Legend
A simple icon legend looks as shown in the image below: