Loading
Configuring the Export Feature
FusionCharts Suite XT lets you export your charts (as JPG, PNG, SVG, and PDF) and chart data (since v3.11.0; as XLS) by using its server-side or client-side (since v3.8.0) export features. Alternatively, FusionCharts also allows you to set up a private server for exporting your charts.
The server-side export feature can be enabled by setting the exportEnabled attribute to 1. To enable the client-side export feature, set the exportEnabled and the exportAtClientSide attributes (described later in this article) to 1.
When export is enabled, the  button appears in the top-right corner of the chart. Clicking this button will display the export menu, as shown in the image below. This menu contains a list of all the possible formats the chart can be exported in.
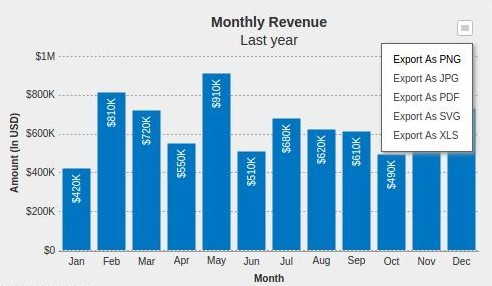
A number of other features can also be configured like the name of the exported file and the display text (in the menu) for each format that is supported. For example, in the chart shown below, we’ve changed menu item label for three out of the five items and changed the default file name (used when the file is downloaded).
{
    "chart": {
        "caption": "Monthly Revenue",
        "subCaption": "Last year",
        "xAxisName": "Month",
        "yAxisName": "Amount (In USD)",
        "numberPrefix": "$",
        "canvasBgAlpha": "0",
        "bgColor": "#DDDDDD",
        "bgAlpha": "50",
        "theme": "fint",
        "exportEnabled": "1",
        "exportFormats": "PNG=Export as High Quality Image|PDF=Export as Printable|XLS=Export Chart Data",
        "exportTargetWindow": "_self",
        "exportFileName": "Monthly_Revenue"
    },
    "data": [
        {
            "label": "Jan",
            "value": "420000"
        },
        {
            "label": "Feb",
            "value": "810000"
        },
        {
            "label": "Mar",
            "value": "720000"
        },
        {
            "label": "Apr",
            "value": "550000"
        },
        {
            "label": "May",
            "value": "910000"
        },
        {
            "label": "Jun",
            "value": "510000"
        },
        {
            "label": "Jul",
            "value": "680000"
        },
        {
            "label": "Aug",
            "value": "620000"
        },
        {
            "label": "Sep",
            "value": "610000"
        },
        {
            "label": "Oct",
            "value": "490000"
        },
        {
            "label": "Nov",
            "value": "900000"
        },
        {
            "label": "Dec",
            "value": "730000"
        }
    ]
}
<html>
<head>
<title>My first chart using FusionCharts Suite XT</title>
<script type="text/javascript" src="http://static.fusioncharts.com/code/latest/fusioncharts.js"></script>
<script type="text/javascript" src="http://static.fusioncharts.com/code/latest/themes/fusioncharts.theme.fint.js?cacheBust=56"></script>
<script type="text/javascript">
FusionCharts.ready(function(){
var fusioncharts = new FusionCharts({
type: 'column2d',
renderAt: 'chart-container',
width: '500',
height: '300',
dataFormat: 'json',
dataSource: {
"chart": {
"caption": "Monthly Revenue",
"subCaption": "Last year",
"xAxisName": "Month",
"yAxisName": "Amount (In USD)",
"numberPrefix": "$",
"canvasBgAlpha": "0",
"bgColor": "#DDDDDD",
"bgAlpha": "50",
"theme": "fint",
"exportEnabled": "1",
"exportFormats": "PNG=Export as High Quality Image|PDF=Export as Printable|XLS=Export Chart Data",
"exportTargetWindow": "_self",
"exportFileName": "Monthly_Revenue"
},
"data": [{
"label": "Jan",
"value": "420000"
}, {
"label": "Feb",
"value": "810000"
}, {
"label": "Mar",
"value": "720000"
}, {
"label": "Apr",
"value": "550000"
}, {
"label": "May",
"value": "910000"
}, {
"label": "Jun",
"value": "510000"
}, {
"label": "Jul",
"value": "680000"
}, {
"label": "Aug",
"value": "620000"
}, {
"label": "Sep",
"value": "610000"
}, {
"label": "Oct",
"value": "490000"
}, {
"label": "Nov",
"value": "900000"
}, {
"label": "Dec",
"value": "730000"
}]
}
}
);
fusioncharts.render();
});
</script>
</head>
<body>
<div id="chart-container">FusionCharts XT will load here!</div>
</body>
</html>The following is a complete list of chart level attributes that can be used to enable and configure exporting of charts:
| Attribute Name | Type | Range | Description |
|---|---|---|---|
|
Boolean |
0/1 |
Enables server-side exporting of charts (as JPG, PNG, SVG, and PDF) and chart data (since v3.11.0; as XLS) when set to 1. |
|
Boolean |
0/1 |
Enables use of a private server for server-side export, when set to 1. |
|
Boolean |
0/1 |
If chart exporting is enabled, this attribute is used to set whether charts will be exported on the client-side or the server-side. Default value: 0 (server-side exporting is enabled; client-side exporting is disabled) |
|
Boolean |
0/1 |
This attribute gives you the option to allow the menu items related to export (for example, Export as JPG etc.) to appear in the context menu of chart. |
|
String |
Lists the format in which the chart can be exported. Custom labels indicating the exported format can also be configured. Example: |
|
|
String |
When a private export server is used, this attribute refers to the path of the Export Handler (the ready-to-use scripts provided by FusionCharts). Make sure to provide the file name along with the path. In case of client-side exporting, this refers to the DOM ID of the FusionCharts Export Component that is embedded in your web page, along with the chart. |
|
|
String |
save or download |
When a private export server is used, the action specifies whether the exported image will be sent back to the client as a download or whether it will be saved on the server. |
|
String |
_self or _blank |
When a private export server is used and |
|
String |
Sets the name of the JavaScript function that is called when the export process completes. |
|
|
String |
Sets the name (excluding the extension) for the output (exported) file. |
Experimental Feature Export with Logo Image
Currently, using the FusionCharts export handler, when a chart having a custom logo is exported as an image, the logo is not present in the generated image. We are introducing an experimental feature, which allows the logo present in the chart to be exported as well and be displayed in the resultant image.
To use this feature, set exportEnabled to 1 (because we are using the server-side export feature), and set exportHandler to the url http://export.api3.fusioncharts.com/logo/. Using this exporter, the generated output will contain the logo along with the chart.
Note that this is an experimental feature and thus might not be a completely reliable solution.