Loading
Creating Charts in PHP using a Database
FusionCharts PHP Wrapper can be downloaded from here.
In addition to directly specifying the chart data (or the URL for the file in which the chart data is stored) directly in the JSON/XML code, you can also fetch data for the chart from a database.
This section showcases how you can do this using the FusionCharts PHP wrapper.
In this section, you will be shown how you can:
-
Create a simple column 2D chart by fetching data from a database
-
Create a multi-series combination chart by fetching data from a database
Before you proceed, make sure you have installed and set up the plugin correctly. Although you can create all kinds of charts using this method, in this section we will focus on only these two examples.
Creating a Column 2D Chart
Assume that you have a fusioncharts_phpsample database with the Country table that stores the population of all countries in the world. Using the data in this database, you want to plot a column 2D chart showing the top ten most populous countries in the world.
You can download this database from the MYSQL website or refer to the sample database available here.
The column 2D chart that we need to render here looks like this:
The data structure needed to render this chart is given below:
<?php

/* Include the `fusioncharts.php` file that contains functions	to embed the charts. */

   include("includes/fusioncharts.php");

/* The following 4 code lines contain the database connection information. Alternatively, you can move these code lines to a separate file and include the file here. You can also modify this code based on your database connection. */

   $hostdb = "localhost";  // MySQl host
   $userdb = "root";  // MySQL username
   $passdb = "";  // MySQL password
   $namedb = "fusioncharts_phpsample";  // MySQL database name

   // Establish a connection to the database
   $dbhandle = new mysqli($hostdb, $userdb, $passdb, $namedb);

   /*Render an error message, to avoid abrupt failure, if the database connection parameters are incorrect */
   if ($dbhandle->connect_error) {
  	exit("There was an error with your connection: ".$dbhandle->connect_error);
   }
?>

<html>
   <head>
  	<title>FusionCharts XT - Column 2D Chart - Data from a database</title>
    <link  rel="stylesheet" type="text/css" href="css/style.css" />

  	<!-- You need to include the following JS file to render the chart.
  	When you make your own charts, make sure that the path to this JS file is correct.
  	Else, you will get JavaScript errors. -->

  	<script src="fusioncharts/fusioncharts.js"></script>
  </head>

   <body>
  	<?php

     	// Form the SQL query that returns the top 10 most populous countries
     	$strQuery = "SELECT Name, Population FROM Country ORDER BY Population DESC LIMIT 10";

     	// Execute the query, or else return the error message.
     	$result = $dbhandle->query($strQuery) or exit("Error code ({$dbhandle->errno}): {$dbhandle->error}");

     	// If the query returns a valid response, prepare the JSON string
     	if ($result) {
        	// The `$arrData` array holds the chart attributes and data
        	$arrData = array(
        	    "chart" => array(
                  "caption" => "Top 10 Most Populous Countries",
                  "showValues" => "0",
                  "theme" => "zune"
              	)
           	);

        	$arrData["data"] = array();

	// Push the data into the array
        	while($row = mysqli_fetch_array($result)) {
           	array_push($arrData["data"], array(
              	"label" => $row["Name"],
              	"value" => $row["Population"]
              	)
           	);
        	}

        	/*JSON Encode the data to retrieve the string containing the JSON representation of the data in the array. */

        	$jsonEncodedData = json_encode($arrData);

	/*Create an object for the column chart using the FusionCharts PHP class constructor. Syntax for the constructor is ` FusionCharts("type of chart", "unique chart id", width of the chart, height of the chart, "div id to render the chart", "data format", "data source")`. Because we are using JSON data to render the chart, the data format will be `json`. The variable `$jsonEncodeData` holds all the JSON data for the chart, and will be passed as the value for the data source parameter of the constructor.*/

        	$columnChart = new FusionCharts("column2D", "myFirstChart" , 600, 300, "chart-1", "json", $jsonEncodedData);

        	// Render the chart
        	$columnChart->render();

        	// Close the database connection
        	$dbhandle->close();
     	}

  	?>

  	<div id="chart-1"><!-- Fusion Charts will render here--></div>

   </body>

</html>
Creating Drill-down Charts
Assume that the fusioncharts_phpsample database also includes the City table that stores the population of all cities in all countries. You now need to plot a chart that shows the top 10 most populous countries and the top 10 most populous cities in these countries.
To show data at different levels of a hierarchy, we use drill-down charts. We will now see how you can create a drill-down column 2D chart based on the above scenario, the data for which will be loaded from a database.
The chart thus rendered looks like this:
To render the above chart, we need two PHP files - country.php and countryDrillDown.php. The country.php file creates a drill-down column 2D chart showing the most populous countries. The countryDrillDown.php file creates column 2D charts that show the most populous cities for the country that was selected in the parent chart.
The data structure in the country.php file is given below:
<?php

/*Include the `fusioncharts.php` file that contains functions
	to embed the charts.
*/
  include("includes/fusioncharts.php");

  /* The following 4 code lines contain the database connection information. Alternatively, you can move these code lines to a separate file and include the file here. You can also modify this code based on your database connection.   */

   $hostdb = "localhost";  // MySQl host
   $userdb = "root";  // MySQL username
   $passdb = "";  // MySQL password
   $namedb = "fusioncharts_phpsample";  // MySQL database name

   // Establish a connection to the database
   $dbhandle = new mysqli($hostdb, $userdb, $passdb, $namedb);

   // Render an error message, to avoid abrupt failure, if the database connection parameters are incorrect
   if ($dbhandle->connect_error) {
  	exit("There was an error with your connection: ".$dbhandle->connect_error);
   }

?>

<html>
   <head>
  	<title>FusionCharts XT - Column 2D Chart - Data from a database</title>
	  <link  rel="stylesheet" type="text/css" href="css/style.css" />

	<!--  Include the `fusioncharts.js` file. This file is needed to render the chart. Ensure that the path to this JS file is correct. Otherwise, it may lead to JavaScript errors. -->

      <script src="fusioncharts/fusioncharts.js"></script>
   </head>
   <body>
  	<?php

     	// Form the SQL query that returns the top 10 most populous countries
     	$strQuery = "SELECT Name, Population, Code FROM Country ORDER BY Population DESC LIMIT 10";

     	// Execute the query, or else return the error message.
     	$result = $dbhandle->query($strQuery) or exit("Error code ({$dbhandle->errno}): {$dbhandle->error}");

     	// If the query returns a valid response, prepare the JSON string
     	if ($result) {
        	// The `$arrData` array holds the chart attributes and data
        	$arrData = array(
                "chart" => array(
                    "caption" => "Top 10 Most Populous Countries",
                    "showValues"=> "0",
                    "theme"=> "zune"
              	)
           	);

        	$arrData["data"] = array();

	// Push the data into the array

        	while($row = mysqli_fetch_array($result)) {
           	array_push($arrData["data"], array(
                "label" => $row["Name"],
                "value" => $row["Population"],
                "link" => "countryDrillDown.php?Country=".$row["Code"]
              	)
           	);
        	}

        	/*JSON Encode the data to retrieve the string containing the JSON representation of the data in the array. */

        	$jsonEncodedData = json_encode($arrData);

        	/*Create an object for the column chart. Initialize this object using the FusionCharts PHP class constructor. The constructor is used to initialize the chart type, chart id, width, height, the div id of the chart container, the data format, and the data source. */

        	$columnChart = new FusionCharts("column2D", "myFirstChart" , 600, 300, "chart-1", "json", $jsonEncodedData);

        	// Render the chart
        	$columnChart->render();

        	// Close the database connection
        	$dbhandle->close();

     	}

  	?>
  	<div id="chart-1"><!-- Fusion Charts will render here--></div>
   </body>
</html>
The data structure for the countryDrillDown.php file is given below:
<?php

 /* Include the `includes/fusioncharts.php` file that contains functions to embed the charts.*/

   include("includes/fusioncharts.php");

  /* The following 4 code lines contains the database connection information. Alternatively, you can move these code lines to a separate file and include the file here. You can also modify this code based on your database connection.   */

   $hostdb = "localhost";  // MySQl host
   $userdb = "root";  // MySQL username
   $passdb = "";  // MySQL password
   $namedb = "fusioncharts_phpsample";  // MySQL database name

   // Establish a connection to the database
   $dbhandle = new mysqli($hostdb, $userdb, $passdb, $namedb);

  /*Render an error message, to avoid abrupt failure, if the database connection parameters are incorrect */
   if ($dbhandle->connect_error) {
  	exit("There was an error with your connection: ".$dbhandle->connect_error);
   }
?>
<html>
   <head>
  	<title>FusionCharts XT - Column 2D Chart</title>
  	<link  rel="stylesheet" type="text/css" href="css/style.css" />

	  <!--  Include the `fusioncharts.js` file. This file is needed to render the chart. Ensure that the path to this JS file is correct. Otherwise, it may lead to JavaScript errors. -->

  	<script src="fusioncharts/fusioncharts.js"></script>
   </head>
   <body>
  	<?php

     	// Get the country code from the GET parameter
     	$countryCode = $_GET["Country"];

     	// Form the SQL query that returns the top 10 most populous cities in the selected country
     	$cityQuery = "SELECT Name, Population FROM City WHERE CountryCode = ? ORDER BY Population DESC LIMIT 10";

     	// Prepare the query statement
     	$cityPrepStmt = $dbhandle->prepare($cityQuery);

     	// If there is an error in the statement, exit with an error message
     	if($cityPrepStmt === false) {
        	exit("Error while preparing the query to fetch data from City Table. ".$dbhandle->error);
     	}

     	// Bind the parameters to the query prepared
     	$cityPrepStmt->bind_param("s", $countryCode);

     	// Execute the query
     	$cityPrepStmt->execute();

     	// Get the results from the query executed
     	$cityResult = $cityPrepStmt->get_result();

     	// If the query returns a valid response, prepare the JSON string
     	if ($cityResult) {

        	/* Form the SQL query that will return the country name based on the country code. The result of the above query contains only the country code. The country name is needed to be rendered as a caption for the chart that shows the 10 most populous cities */

        	$countryNameQuery = "SELECT Name FROM Country WHERE Code = ?";

        	// Prepare the query statement
        	$countryPrepStmt = $dbhandle->prepare($countryNameQuery);

        	// If there is an error in the statement, exit with an error message
        	if($countryPrepStmt === false) {
           	exit("Error while preparing the query to fetch data from Country Table. ".$dbhandle->error);
        	}

        	// Bind the parameters to the query prepared
        	$countryPrepStmt->bind_param("s", $countryCode);

        	// Execute the query
        	$countryPrepStmt->execute();

        	// Bind the country name to the variable `$countryName`
        	$countryPrepStmt->bind_result($countryName);

        	// Fetch the result from prepared statement
        	$countryPrepStmt->fetch();

        	// The `$arrData` array holds the chart attributes and data
        	$arrData = array(
                "chart" => array(
                    "caption" => "Top 10 Most Populous Cities in ".$countryName,
                    "showValues"=> "0",
                    "theme"=> "zune"
              	)
           	);

        	$arrData["data"] = array();

	// Push the data into the array
        	while($row = $cityResult->fetch_array()) {
                array_push($arrData["data"], array(
              	"label" => $row["Name"],
              	"value" => $row["Population"]
              	)
           	);
        	}

           /*JSON Encode the data to retrieve the string containing the JSON representation of the data in the array. */

        	$jsonEncodedData = json_encode($arrData);

      	  /*Create an object for the column chart using the FusionCharts PHP class constructor. Syntax for the constructor is `FusionCharts("type of chart", "unique chart id", "width of chart", "height of chart", "div id to render the chart", "data format", "data source")`.*/

        	$columnChart = new FusionCharts("column2D", "myFirstChart" , 600, 300, "chart-1", "json", $jsonEncodedData);

        	// Render the chart
        	$columnChart->render();

        	// Close the database connection
        	$dbhandle->close();
     	}
  	?>

  	<a href="country.php">Back</a>
  	<div id="chart-1"><!-- Fusion Charts will render here--></div>
   </body>
</html>
Create a Multi-series 2D Single Y Combination Chart
Assume that you have a fusioncharts_phpsample database with the Revenue table that stores sales report of Harry’s Supermart of last year. Using the data in this database, you want to plot multi-series combination chart showing the sales analysis of Harry’s Supermart for 12 months.
The multi-series combination chart that we need to render here looks like this:
Before we dive into the code, let’s see what the JSON data for a multi-series combination 2D chart should look like. We have a sales data of Harry’s Supermart for last year.
In the code below, you can see the data for 12 months.
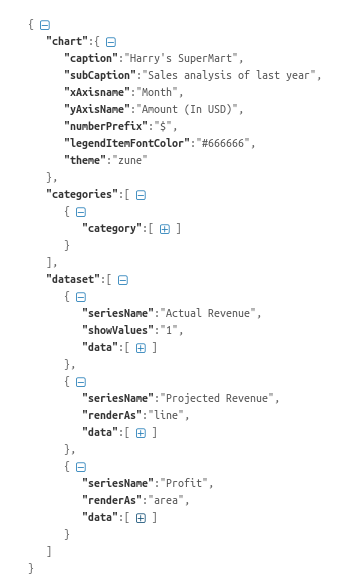
The final JSON code that we need for this sample should be as shown below:
{
    "chart": {
        "caption": "Harry's SuperMart",
        "subCaption": "Sales analysis of last year",
        "xAxisname": "Month",
        "yAxisName": "Amount (In USD)",
        "numberPrefix": "$",
        "legendItemFontColor": '#666666',
        "theme": "zune"
    },
    "categories": [{
        "category": [{
            "label": "Jan"
        }, {
            "label": "Feb"
        }, {
            "label": "Mar"
        }, {
            "label": "Apr"
        }, {
            "label": "May"
        }, {
            "label": "Jun"
        }, {
            "label": "Jul"
        }, {
            "label": "Aug"
        }, {
            "label": "Sep"
        }, {
            "label": "Oct"
        }, {
            "label": "Nov"
        }, {
            "label": "Dec"
        }]
    }],
    "dataset": [{
        "seriesName": "Actual Revenue",
        "showValues": "1",
        "data": [{
            "value": "16000"
        }, {
            "value": "20000"
        }, {
            "value": "18000"
        }, {
            "value": "19000"
        }, {
            "value": "15000"
        }, {
            "value": "21000"
        }, {
            "value": "16000"
        }, {
            "value": "20000"
        }, {
            "value": "17000"
        }, {
            "value": "25000"
        }, {
            "value": "19000"
        }, {
            "value": "23000"
        }]
    }, {
        "seriesName": "Projected Revenue",
        "renderAs": "line",
        "data": [{
            "value": "15000"
        }, {
            "value": "16000"
        }, {
            "value": "17000"
        }, {
            "value": "18000"
        }, {
            "value": "19000"
        }, {
            "value": "19000"
        }, {
            "value": "19000"
        }, {
            "value": "19000"
        }, {
            "value": "20000"
        }, {
            "value": "21000"
        }, {
            "value": "22000"
        }, {
            "value": "23000"
        }]
    }, {
        "seriesName": "Profit",
        "renderAs": "area",
        "data": [{
            "value": "4000"
        }, {
            "value": "5000"
        }, {
            "value": "3000"
        }, {
            "value": "4000"
        }, {
            "value": "1000"
        }, {
            "value": "7000"
        }, {
            "value": "1000"
        }, {
            "value": "4000"
        }, {
            "value": "1000"
        }, {
            "value": "8000"
        }, {
            "value": "2000"
        }, {
            "value": "7000"
        }]
    }]
}
Now let’s move on to the PHP code that will generate the above JSON data.
<?php

/* Include the `include/fusioncharts.php` file that contains functions to embed the charts.*/

include("include/fusioncharts.php");

/* The following 4 code lines contains the database connection information. Alternatively, you can move these code lines to a separate file and include the file here. You can also modify this code based on your database connection.   */

$hostdb = "localhost";  // MySQl host
$userdb = "root";  // MySQL username
$passdb = "";  // MySQL password
$namedb = "mscombi2d";  // MySQL database name

// Establish a connection to the database
$dbhandle = new mysqli($hostdb, $userdb, $passdb, $namedb);

/*Render an error message, to avoid abrupt failure, if the database connection parameters are incorrect */
if ($dbhandle->connect_error) {
  exit("There was an error with your connection: ".$dbhandle->connect_error);
}
?>

    <html>

    <head>
        <title>FusionCharts | Multi-Series Chart using PHP and MySQL</title>
        <script src="http://static.fusioncharts.com/code/latest/fusioncharts.js"></script>
        <script src="http://static.fusioncharts.com/code/latest/fusioncharts.charts.js"></script>
        <script src="http://static.fusioncharts.com/code/latest/themes/fusioncharts.theme.zune.js"></script>
    </head>

    <body>

        <?php

  $strQuery = "SELECT DISTINCT category, value1, value2, value3 FROM mscombi2ddata; ";
  $result = $dbhandle->query($strQuery) or exit("Error code ({$dbhandle->errno}): {$dbhandle->error}");
  if ($result) {

  $arrData = array(
        "chart" => array(
            "caption"=> "Harry's SuperMart",
            "subCaption"=> "Sales analysis of last year",
            "xAxisname"=> "Month",
            "yAxisName"=> "Revenues (In USD)",
            "numberPrefix"=> "$",
            "legendItemFontColor"=> "#666666",
            "theme"=> "zune"
            )
          );
          // creating array for categories object

          $categoryArray=array();
          $dataseries1=array();
          $dataseries2=array();
          $dataseries3=array();

          // pushing category array values
          while($row = mysqli_fetch_array($result)) {
            array_push($categoryArray, array(
            "label" => $row["category"]
          )
        );
        array_push($dataseries1, array(
          "value" => $row["value1"]
          )
        );

        array_push($dataseries2, array(
          "value" => $row["value2"]
          )
        );
        array_push($dataseries3, array(
          "value" => $row["value3"]
          )
        );

      }

      $arrData["categories"]=array(array("category"=>$categoryArray));
      // creating dataset object
      $arrData["dataset"] = array(array("seriesName"=> "Actual Revenue", "data"=>$dataseries1), array("seriesName"=> "Projected Revenue",  "renderAs"=>"line", "data"=>$dataseries2),array("seriesName"=> "Profit",  "renderAs"=>"area", "data"=>$dataseries3));


      /*JSON Encode the data to retrieve the string containing the JSON representation of the data in the array. */
      $jsonEncodedData = json_encode($arrData);

      // chart object
      $msChart = new FusionCharts("mscombi2d", "chart1" , "600", "350", "chart-container", "json", $jsonEncodedData);

      // Render the chart
      $msChart->render();

      // closing db connection
      $dbhandle->close();

   }

?>

            <center>
                <div id="chart-container">Chart will render here!</div>
            </center>
    </body>

    </html>
Want to try out the above samples at your local environment? You can download the samples from here .