Loading
Configuring Drag-able Charts
FusionCharts Suite XT allows you to configure the axis limits and division intervals for drag-able charts.
In this section, you will be shown how you can:
Changing Axis Limits
The chart, by default, calculates the y-axis upper and lower limits based on the data provided to it. If you want any column to assume a value not covered within this axis range, you can increase or decrease the limits using the menu button at the top-right of the chart.

When the menu button is clicked, a pop-up with the options to increase or decrease the upper and lower limits is revealed. Clicking on this menu button will reveal a menu with the options to increase or decrease the upper and lower limits.
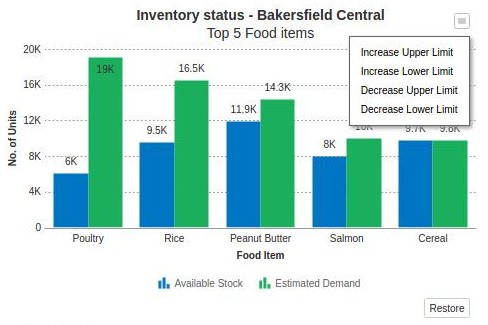
When you select any of the above options, the chart limits are increased or decreased using auto-calculated intervals. However, If you want to set manual values for the upper/lower limits, you can just click the limits and edit them directly.
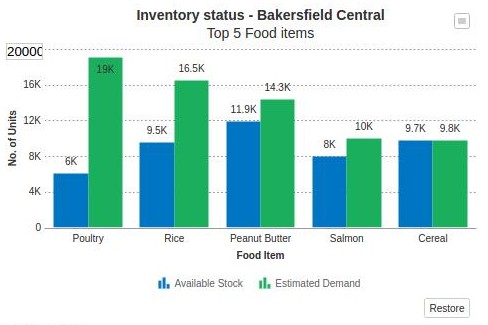
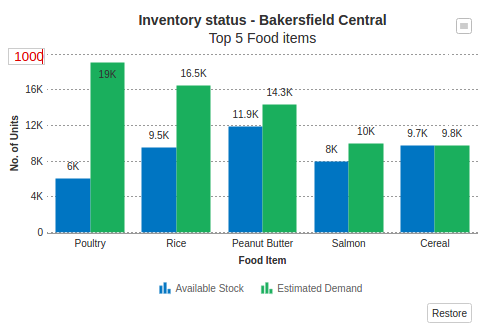
If you enter a limit value which cannot be accepted by the chart, the value will turn red to indicate that the value can not be accepted.
Managing Chart Limits Using JavaScript API
FusionCharts Suite XT allows you to set and retrieve the charts’ upper and lower limits using JavaScript APIs.
A drag-able area chart configured to manage chart limits using JavaScript API looks like this:
{
    "chart": {
        "caption": "Quarterly Unit Sales - Apple vs. Samsung",
        "subCaption": "Drag anchors to change estimated values",
        "subCaptionFontSize": "12",
        "xAxisName": "Quarter",
        "yAxisName": "No. of Units",
        "theme": "fint"
    },
    "categories": [
        {
            "category": [
                {
                    "label": "Q1"
                },
                {
                    "label": "Q2"
                },
                {
                    "label": "Q3(E)"
                },
                {
                    "label": "Q4(E)"
                }
            ]
        }
    ],
    "dataset": [
        {
            "seriesname": "Apple",
            "valuePosition": "ABOVE",
            "allowDrag": "0",
            "data": [
                {
                    "value": "1200"
                },
                {
                    "value": "1500",
                    "dashed": "1"
                },
                {
                    "value": "1300",
                    "allowDrag": "1",
                    "dashed": "1"
                },
                {
                    "value": "900",
                    "allowDrag": "1",
                    "tooltext": "Predicted sales $value units"
                }
            ]
        },
        {
            "seriesname": "Samsung",
            "allowDrag": "0",
            "data": [
                {
                    "value": "600"
                },
                {
                    "value": "850",
                    "dashed": "1"
                },
                {
                    "value": "1000",
                    "allowDrag": "1",
                    "dashed": "1"
                },
                {
                    "value": "1200",
                    "allowDrag": "1",
                    "tooltext": "Predicted sales $value units"
                }
            ]
        }
    ]
}
<html>
<head>
<title>My first chart using FusionCharts Suite XT</title>
<script type="text/javascript" src="http://static.fusioncharts.com/code/latest/fusioncharts.js"></script>
<script type="text/javascript" src="http://static.fusioncharts.com/code/latest/themes/fusioncharts.theme.fint.js?cacheBust=56"></script>
<script type="text/javascript">
FusionCharts.ready(function(){
var fusioncharts = new FusionCharts({
type: 'dragarea',
renderAt: 'chart-container',
width: '500',
height: '350',
dataFormat: 'json',
dataSource: {
"chart": {
"caption": "Quarterly Unit Sales - Apple vs. Samsung",
"subCaption": "Drag anchors to change estimated values",
"subCaptionFontSize": "12",
"xAxisName": "Quarter",
"yAxisName": "No. of Units",
"theme": "fint"
},
"categories": [{
"category": [{
"label": "Q1"
}, {
"label": "Q2"
}, {
"label": "Q3(E)"
}, {
"label": "Q4(E)"
}]
}],
"dataset": [{
"seriesname": "Apple",
"valuePosition": "ABOVE",
"allowDrag": "0",
"data": [{
"value": "1200"
}, {
"value": "1500",
"dashed": "1"
}, {
"value": "1300",
"allowDrag": "1",
"dashed": "1"
}, {
"value": "900",
"allowDrag": "1",
"tooltext": "Predicted sales $value units"
}]
}, {
"seriesname": "Samsung",
"allowDrag": "0",
"data": [{
"value": "600"
}, {
"value": "850",
"dashed": "1"
}, {
"value": "1000",
"allowDrag": "1",
"dashed": "1"
}, {
"value": "1200",
"allowDrag": "1",
"tooltext": "Predicted sales $value units"
}]
}]
},
events: {
'rendered': function(evtObj, argObj) {
var chartIns = evtObj.sender,
chartMaxLimit = chartIns.getUpperLimit(),
chartMinLimit = chartIns.getLowerLimit();
document.getElementById('max-limit').value = chartMaxLimit;
document.getElementById('min-limit').value = chartMinLimit;
},
'beforeRender': function(evt, args) {
if (!document.getElementById('controllers')) {
var controllers = document.createElement('div'),
chartRef = evt.sender,
maxBtn,
minBtn,
maxTxtFld,
minTxtFld,
setMaxLimit = function() {
var maxLimit = maxTxtFld.value,
crntLimit = chartRef && chartRef.getUpperLimit(),
status;
if (maxLimit != crntLimit) {
status = chartRef && chartRef.setUpperLimit(maxLimit);
if (status) {
alert('Max limit updated successfully');
} else {
maxTxtFld.value = crntLimit;
alert('Max limit could not be updated!')
}
}
},
setMinLimit = function() {
var minLimit = minTxtFld.value,
crntLimit = chartRef && chartRef.getLowerLimit(),
status;
if (minLimit != crntLimit) {
status = chartRef && chartRef.setLowerLimit(minLimit);
if (status) {
alert('Min limit updated successfully');
} else {
minTxtFld.value = crntLimit;
alert('Min limit could not be updated!')
}
}
};
controllers.setAttribute('id', 'controllers');
// Create elements inside div
controllers.innerHTML = '<div id="controllers" style="margin-left: 20px;font-weight:bold;"><p>Reset values to update limits.<p><div style="padding-top: 10px;"><span><input type="text" id="max-limit" style="max-width: 100px;font-weight: bold; margin-bottom:0px !important;"/><input type="button" id="max-btn" style="font-size: 16px; margin-left: 5px; margin-top: 0px; padding: 2px 5px; width:120px;" value="Set Max Value"/></span></div><div style="padding-top: 10px;"><span><input type="text" id="min-limit" style="max-width: 100px;font-weight: bold; margin-bottom:0px !important;"/><input type="button" id="min-btn" style="font-size: 16px; margin-left: 5px; margin-top: 0px; padding: 2px 5px; width:120px;" value="Set Min Value"/></span></div></div>';
args.container.parentNode.insertBefore(controllers, args.container.nextSibling);
maxBtn = document.getElementById('max-btn');
minBtn = document.getElementById('min-btn');
maxTxtFld = document.getElementById('max-limit');
minTxtFld = document.getElementById('min-limit');
//Add listener to buttons
if (maxBtn.addEventListener) {
maxBtn.addEventListener("click", setMaxLimit);
minBtn.addEventListener("click", setMinLimit);
} else {
maxBtn.onclick && maxBtn.onclick(setMaxLimit);
minBtn.onclick && minBtn.onclick(setMinLimit);
}
}
}
}
}
);
fusioncharts.render();
});
</script>
</head>
<body>
<div id="chart-container">FusionCharts XT will load here!</div>
</body>
</html>Give below is a brief description of the JavaScript functions used to manage chart limits:
| Method Name | Description |
|---|---|
|
It is used to specify the new upper limit for the chart. It takes a numeric value for the limit as the parameter. If the value is greater than the maximum value of all the data plots of the chart, the chart sets the new upper limit of the chart and returns true. If the value is less than the maximum value of the data plots, the chart does not set the upper limit and returns false. |
|
It is used to specify the new lower limit for the chart. It takes a numeric value for the limit as the parameter. If the value is less than the minimum value of all the data plots of the chart, the chart sets the new lower limit of the chart and returns true. If the value is greater than the minimum value of the data plots, the chart does not set the lower limit and returns false. |
|
It is used to return the current upper limit of the chart. |
|
It is used to return the current lower limit of the chart. |
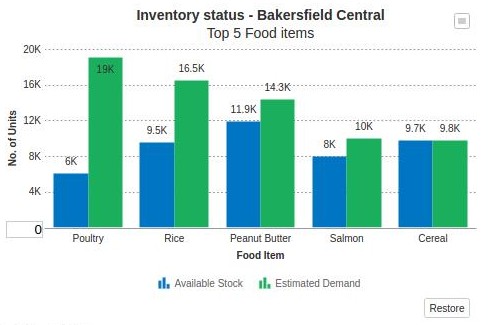
Snapping to the Nearest Divisional Lines
FusionCharts XT allows you to limit the dragging of data plots with respect to the divisional lines on the chart i.e. you can configure a data plot to snap to the nearest divisional line if it falls within a specified distance of the divisional line.
A drag-able column chart configured for snapping to the nearest div interval looks like this:
{
    "chart": {
        "caption": "Inventory status - Bakersfield Central",
        "subCaption": "Top 5 Food items",
        "xAxisName": "Food Item",
        "yAxisName": "No. of Units",
        "snapToDiv": "1",
        "snapToDivRelaxation": "5",
        "theme": "fint"
    },
    "categories": [
        {
            "category": [
                {
                    "label": "Poultry"
                },
                {
                    "label": "Rice"
                },
                {
                    "label": "Peanut Butter"
                },
                {
                    "label": "Salmon"
                },
                {
                    "label": "Cereal"
                }
            ]
        }
    ],
    "dataset": [
        {
            "seriesname": "Available Stock",
            "allowDrag": "0",
            "data": [
                {
                    "value": "6000"
                },
                {
                    "value": "9500"
                },
                {
                    "value": "11900"
                },
                {
                    "value": "8000"
                },
                {
                    "value": "9700"
                }
            ]
        },
        {
            "seriesname": "Estimated Demand",
            "dashed": "1",
            "data": [
                {
                    "value": "19000"
                },
                {
                    "value": "16500"
                },
                {
                    "value": "14300"
                },
                {
                    "value": "10000"
                },
                {
                    "value": "9800"
                }
            ]
        }
    ]
}
<html>
<head>
<title>My first chart using FusionCharts Suite XT</title>
<script type="text/javascript" src="http://static.fusioncharts.com/code/latest/fusioncharts.js"></script>
<script type="text/javascript" src="http://static.fusioncharts.com/code/latest/themes/fusioncharts.theme.fint.js?cacheBust=56"></script>
<script type="text/javascript">
FusionCharts.ready(function(){
var fusioncharts = new FusionCharts({
type: 'dragcolumn2d',
renderAt: 'chart-container',
width: '500',
height: '350',
dataFormat: 'json',
dataSource: {
"chart": {
"caption": "Inventory status - Bakersfield Central",
"subCaption": "Top 5 Food items",
"xAxisName": "Food Item",
"yAxisName": "No. of Units",
"snapToDiv": "1",
"snapToDivRelaxation": "5",
"theme": "fint"
},
"categories": [{
"category": [{
"label": "Poultry"
}, {
"label": "Rice"
}, {
"label": "Peanut Butter"
}, {
"label": "Salmon"
}, {
"label": "Cereal"
}]
}],
"dataset": [{
"seriesname": "Available Stock",
"allowDrag": "0",
"data": [{
"value": "6000"
}, {
"value": "9500"
}, {
"value": "11900"
}, {
"value": "8000"
}, {
"value": "9700"
}]
}, {
"seriesname": "Estimated Demand",
"dashed": "1",
"data": [{
"value": "19000"
}, {
"value": "16500"
}, {
"value": "14300"
}, {
"value": "10000"
}, {
"value": "9800"
}]
}]
},
events: {
'beforeRender': function(event, args) {
var tableCont = document.createElement('div'),
thStyle = "background-color: #008ee4;color: #fff; border: 1px solid #6baa01;padding: 10px 5px;min-width: 70px;text-align: center",
tdStyle = "background-color: #fff;color: #6baa01; border: 1px solid #6baa01; padding: 10px 5px;min-width: 70px;text-align: center",
strHTML = "";
tableCont.setAttribute('id', 'tableCont');
tableContsetAttribute('style', 'padding-left: 10px; width: 470px;');;
strHTML = "<table style='margin: 25px auto;border-collapse: collapse;border: 1px solid;border-bottom: 2px solid #6baa01'><tr><td style='border: 1px solid #fff;padding: 10px 5px;min-width: 70px;text-align: center'></td><th style='" + thStyle + "'>Poultry</th><th style='" + thStyle + "'>Rice</th><th style='" + thStyle + "'>Peanut Butter</th><th style='" + thStyle + "'>Salmon</th><th style='" + thStyle + "'>Cereal</th></tr><tr><td style='background-color: #6baa01;color: #fff; border: 1px solid #6baa01; padding: 10px 5px;min-width: 70px;text-align: center'>Estimated Demand</td><td id='est-1' style='" + tdStyle + "'>19000</td><td id='est-2' style='" + tdStyle + "'>16500</td><td id='est-3' style='" + tdStyle + "'>14300</td><td id='est-4' style='" + tdStyle + "'>10000</td><td id='est-5' style='" + tdStyle + "'>9800</td></tr></table>";
tableCont.innerHTML = strHTML;
args.container.parentNode.insertBefore(tableCont, args.container.nextSibling);
},
'dataplotDragEnd': function(evt, arg) {
var dtIndx = arg && arg.dataIndex,
val = arg && parseInt(arg.endValue, 10);
document.getElementById('est-' + dtIndx).innerHTML = val;
},
'dataRestored': function(evtObj) {
var estimatedOrigValues = ["19000", "16500", "14300", "10000", "9800"],
numVals = estimatedOrigValues.length,
i,
val;
for (i = 0; i < numVals; i += 1) {
val = estimatedOrigValues[i];
document.getElementById('est-' + (i + 1)).innerHTML = val;
}
}
}
}
);
fusioncharts.render();
});
</script>
</head>
<body>
<div id="chart-container">FusionCharts XT will load here!</div>
</body>
</html>Given below is a brief description of the attributes used to configure snapping to the nearest divisional line:
| Attribute Name | Description |
|---|---|
|
It is used to specify whether the data points can be dragged only to the nearest divisional lines on the chart. That means, the data points cannot acquire a value between any two divisional lines and, as such, they will always fall on a divisional line value. |
|
When dragging the area plots, you can snap them to the nearest divisional line on chart. To do so, just set this attribute as |
|
It is used to specify the distance in pixels from the divisional lines where the data points will behave sticky. This attribute works only when the |
|
It is used to specify whether the data points will stick to any divisional lines. Setting this attribute to |