Loading
Introduction to exporting charts as image and pdf
FusionCharts Suite XT uses JavaScript to render charts in the browser using SVG and VML. It also allows you to export charts—as images, PDF files, or as Excel spreadsheets. The export is done using a server-side helper library that converts the SVG to image/PDF/XLS. VML can also be exported as it is internally converted to SVG before exporting. During the export, the data is sent to the FusionCharts servers for processing and generating the image/PDF/XLS.
You must have an active internet connection for this feature to work.
The export formats currently supported are :
- JPG
- PNG
- SVG
- XLS (since v3.11.0)
To export a chart in the XLS format, using server-side exporting, it is mandatory that the exporting server has the latest code, which is available in the FusionCharts package. Alternatively, the FusionCharts export link, export.api3.fusioncharts.com, can also be used. For client-side exporting, download as XLS is supported only by modern browsers with canvas support (except Safari and IE9).
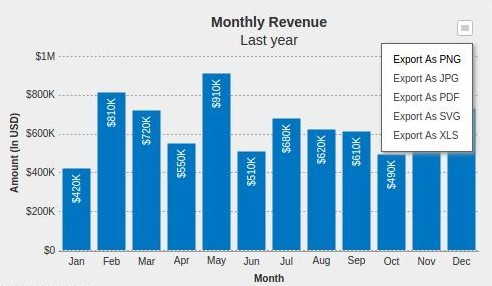
To enable server-side exporting, the chart level attribute exportEnabled is set to 1. The  menu button is now visible in the top-right corner of the chart. Click/hover over this menu button to see the dropdown menu with the export options, as shown in the image below:
The chart is downloaded to your machine in the selected format.
A column 2D chart with export enabled is shown below:
{
    "chart": {
        "caption": "Monthly Revenue",
        "subCaption": "Last year",
        "xAxisName": "Month",
        "yAxisName": "Amount (In USD)",
        "numberPrefix": "$",
        "canvasBgAlpha": "0",
        "bgColor": "#DDDDDD",
        "bgAlpha": "50",
        "theme": "fint",
        "exportEnabled": "1"
    },
    "data": [
        {
            "label": "Jan",
            "value": "420000"
        },
        {
            "label": "Feb",
            "value": "810000"
        },
        {
            "label": "Mar",
            "value": "720000"
        },
        {
            "label": "Apr",
            "value": "550000"
        },
        {
            "label": "May",
            "value": "910000"
        },
        {
            "label": "Jun",
            "value": "510000"
        },
        {
            "label": "Jul",
            "value": "680000"
        },
        {
            "label": "Aug",
            "value": "620000"
        },
        {
            "label": "Sep",
            "value": "610000"
        },
        {
            "label": "Oct",
            "value": "490000"
        },
        {
            "label": "Nov",
            "value": "900000"
        },
        {
            "label": "Dec",
            "value": "730000"
        }
    ]
}
<html>
<head>
<title>My first chart using FusionCharts Suite XT</title>
<script type="text/javascript" src="http://static.fusioncharts.com/code/latest/fusioncharts.js"></script>
<script type="text/javascript" src="http://static.fusioncharts.com/code/latest/themes/fusioncharts.theme.fint.js?cacheBust=56"></script>
<script type="text/javascript">
FusionCharts.ready(function(){
var fusioncharts = new FusionCharts({
type: 'column2d',
renderAt: 'chart-container',
width: '500',
height: '300',
dataFormat: 'json',
dataSource: {
"chart": {
"caption": "Monthly Revenue",
"subCaption": "Last year",
"xAxisName": "Month",
"yAxisName": "Amount (In USD)",
"numberPrefix": "$",
"canvasBgAlpha": "0",
"bgColor": "#DDDDDD",
"bgAlpha": "50",
"theme": "fint",
"exportEnabled": "1"
},
"data": [{
"label": "Jan",
"value": "420000"
}, {
"label": "Feb",
"value": "810000"
}, {
"label": "Mar",
"value": "720000"
}, {
"label": "Apr",
"value": "550000"
}, {
"label": "May",
"value": "910000"
}, {
"label": "Jun",
"value": "510000"
}, {
"label": "Jul",
"value": "680000"
}, {
"label": "Aug",
"value": "620000"
}, {
"label": "Sep",
"value": "610000"
}, {
"label": "Oct",
"value": "490000"
}, {
"label": "Nov",
"value": "900000"
}, {
"label": "Dec",
"value": "730000"
}]
}
}
);
fusioncharts.render();
});
</script>
</head>
<body>
<div id="chart-container">FusionCharts XT will load here!</div>
</body>
</html>Click the insert image here menu button and select a format to export the chart.
To process the export data on your own server, you can configure one of the export handlers by following the Setup Private Export Server guide.
Starting version 3.8.0, FusionCharts Suite XT has also enabled the client-side export feature. The client-side export feature removes the round-trip involved in exporting from a server while also addressing the data confidentiality issues that may arise from using a publicly hosted server. To enable client-side exporting, the exportAtClientSide attribute (also a chart level attribute) is set to 1.