Changed Behavior
This section is for users who are using previous version of FusionCharts in their application. Here we'll talk about the change in behavior of the charts after v3.13.0.
Updated Options Menu
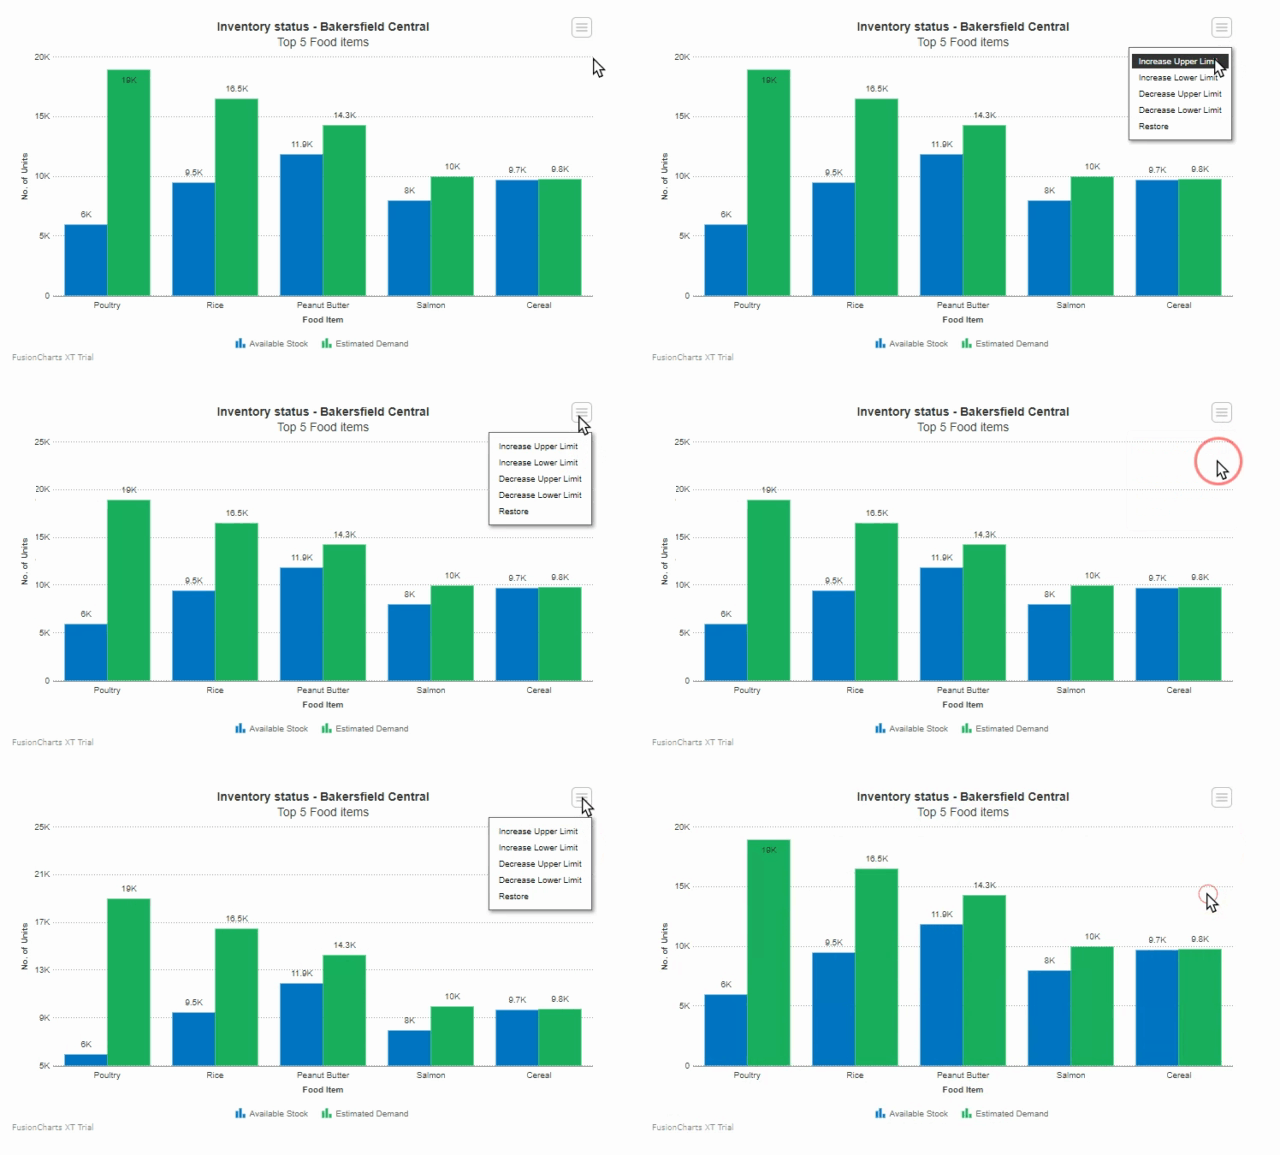
The restore and submit button in select-scatter and drag-able chart has been moved to options menu. From v3.13.0 if you want to restore or submit your chart, click on the respective option in the options menu at the top right corner of the canvas.
The options menu looks like shown below:

Following is the list of attributes which have been replaced with new ones:
| Old Attribute | New Attribute |
|---|---|
showFormBtn (deprecated) |
enableSubmit |
formBtnTitle (deprecated) |
submitText |
showRestoreBtn (deprecated) |
enableRestore |
restoreBtnTitle (deprecated) |
restoreText |
Inversed Data Plot
The inverse y-axis charts are similar to the normal column charts, except that the y-axis in these charts are inverted. The lower limit and upper limit value positions are swapped in the inverse y-axis chart. In v3.13.0 inverse chart comes with a new appearance, i.e., the data plots (column and area) will now appear from the top of the canvas.
The inverse data plots (column and area) will be applicable to the charts with positive y-axis range (> = 0).
The new visualization of the inverse chart looks like:
{
    "chart": {
        "caption": "Average Page Load Time (hsm.com)",
        "subCaption": "Last Week",
        "showBorder": "0",
        "xAxisName": "Day",
        "yAxisName": "Time (In Sec)",
        "numberSuffix": "s",
        "placeValuesInside": "0",
        "valueFontColor": "#333333",
        "rotateValues": "0",
        "theme": "fusion"
    },
    "categories": [
        {
            "category": [
                {
                    "label": "Mon"
                },
                {
                    "label": "Tue"
                },
                {
                    "label": "Wed"
                },
                {
                    "label": "Thu"
                },
                {
                    "label": "Fri"
                },
                {
                    "label": "Sat"
                },
                {
                    "label": "Sun"
                }
            ]
        }
    ],
    "dataset": [
        {
            "seriesname": "Loading Time",
            "allowDrag": "0",
            "data": [
                {
                    "value": "6"
                },
                {
                    "value": "5.8"
                },
                {
                    "value": "5"
                },
                {
                    "value": "4.3"
                },
                {
                    "value": "4.1"
                },
                {
                    "value": "3.8"
                },
                {
                    "value": "3.2"
                }
            ]
        }
    ]
}<html>
<head>
<title>My first chart using FusionCharts Suite XT</title>
<script type="text/javascript" src="https://cdn.fusioncharts.com/fusioncharts/latest/fusioncharts.js"></script>
<script type="text/javascript" src="https://cdn.fusioncharts.com/fusioncharts/latest/themes/fusioncharts.theme.fusion.js"></script>
<script type="text/javascript">
FusionCharts.ready(function(){
var fusioncharts = new FusionCharts({
type: 'InverseMSColumn2D',
id: 'time-chart',
dataFormat: 'json',
renderAt: 'chart-container',
width: '500',
height: '300',
dataSource: {
"chart": {
"caption": "Average Page Load Time (hsm.com)",
"subCaption": "Last Week",
"showBorder": "0",
"xAxisName": "Day",
"yAxisName": "Time (In Sec)",
"numberSuffix": "s",
"placeValuesInside": "0",
"valueFontColor": "#333333",
"rotateValues": "0",
"theme": "fusion"
},
"categories": [{
"category": [{
"label": "Mon"
}, {
"label": "Tue"
}, {
"label": "Wed"
}, {
"label": "Thu"
}, {
"label": "Fri"
}, {
"label": "Sat"
}, {
"label": "Sun"
}]
}],
"dataset": [{
"seriesname": "Loading Time",
"allowDrag": "0",
"data": [{
"value": "6"
}, {
"value": "5.8"
}, {
"value": "5"
}, {
"value": "4.3"
}, {
"value": "4.1"
}, {
"value": "3.8"
}, {
"value": "3.2"
}]
}]
}
});
fusioncharts.render();
});
</script>
</head>
<body>
<div id="chart-container">FusionCharts XT will load here!</div>
</body>
</html>If you like to view the chart as in older version (3.12.2), contact [email protected] .
Secondary Data Plots overlap Primary Data Plots
From version 3.13.0 visualization of dual y-axis multi-series chart is changed. Now, if the data plots for both the axes are set as column, the secondary plots overlaps the primary plots.
The multi-series chart with both the data plots set as column looks like:
{
    "chart": {
        "caption": "Major League Baseball - Season Rankings",
        "subCaption": "Teams in the Lead",
        "xAxisName": "Team",
        "yAxisName": "Matches",
        "syAxisName": "Wins",
        "theme": "fusion",
        "syaxismaxvalue": "100",
        "showValues": "0"
    },
    "categories": [
        {
            "category": [
                {
                    "label": "Boston Red Sox"
                },
                {
                    "label": "New York Yankees"
                },
                {
                    "label": "Tampa Bay Rays"
                },
                {
                    "label": "Toronto Blue Jays"
                },
                {
                    "label": "Baltimore Orioles"
                },
                {
                    "label": "Cleveland Indians"
                },
                {
                    "label": "Detroit Tigers"
                },
                {
                    "label": "Minnesota Twins"
                },
                {
                    "label": "Chicago White Sox"
                },
                {
                    "label": "Kansas City Royals"
                }
            ]
        }
    ],
    "dataset": [
        {
            "seriesname": "Matches",
            "data": [
                {
                    "value": "88"
                },
                {
                    "value": "84"
                },
                {
                    "value": "86"
                },
                {
                    "value": "86"
                },
                {
                    "value": "85"
                },
                {
                    "value": "85"
                },
                {
                    "value": "88"
                },
                {
                    "value": "83"
                },
                {
                    "value": "86"
                },
                {
                    "value": "86"
                }
            ]
        },
        {
            "seriesname": "Wins",
            "parentYAxis": "S",
            "renderAs": "column",
            "data": [
                {
                    "value": "57"
                },
                {
                    "value": "54"
                },
                {
                    "value": "42"
                },
                {
                    "value": "39"
                },
                {
                    "value": "24"
                },
                {
                    "value": "46"
                },
                {
                    "value": "38"
                },
                {
                    "value": "35"
                },
                {
                    "value": "29"
                },
                {
                    "value": "25"
                }
            ]
        }
    ]
}<html>
<head>
<title>My first chart using FusionCharts Suite XT</title>
<script type="text/javascript" src="https://cdn.fusioncharts.com/fusioncharts/latest/fusioncharts.js"></script>
<script type="text/javascript" src="https://cdn.fusioncharts.com/fusioncharts/latest/themes/fusioncharts.theme.fusion.js"></script>
<script type="text/javascript">
FusionCharts.ready(function(){
var fusioncharts = new FusionCharts({
"type": "mscombidy2d",
"renderAt": "chartContainer",
"width": "700",
"height": "400",
"dataFormat": "json",
"dataSource": {
"chart": {
"caption": "Major League Baseball - Season Rankings",
"subCaption": "Teams in the Lead",
"xAxisName": "Team",
"yAxisName": "Matches",
"syAxisName": "Wins",
"theme": "fusion",
"syaxismaxvalue": "100",
"showValues": "0"
},
"categories": [{
"category": [{
"label": "Boston Red Sox"
}, {
"label": "New York Yankees"
}, {
"label": "Tampa Bay Rays"
}, {
"label": "Toronto Blue Jays"
}, {
"label": "Baltimore Orioles"
}, {
"label": "Cleveland Indians"
}, {
"label": "Detroit Tigers"
}, {
"label": "Minnesota Twins"
}, {
"label": "Chicago White Sox"
}, {
"label": "Kansas City Royals"
}]
}],
"dataset": [{
"seriesname": "Matches",
"data": [{
"value": "88"
}, {
"value": "84"
}, {
"value": "86"
}, {
"value": "86"
}, {
"value": "85"
}, {
"value": "85"
}, {
"value": "88"
}, {
"value": "83"
}, {
"value": "86"
}, {
"value": "86"
}
]
},
{
"seriesname": "Wins",
"parentYAxis": "S",
"renderAs": "column",
"data": [{
"value": "57"
}, {
"value": "54"
}, {
"value": "42"
}, {
"value": "39"
}, {
"value": "24"
}, {
"value": "46"
}, {
"value": "38"
}, {
"value": "35"
}, {
"value": "29"
}, {
"value": "25"
}, ]
},
]
}
});
fusioncharts.render();
});
</script>
</head>
<body>
<div id="chart-container">FusionCharts XT will load here!</div>
</body>
</html>If you like to view the chart as in older version (3.12.2), contact [email protected] .
npm Package Updated for Angular
From v3.13.0, following packages for angular has been remaned:
angular-fusionchartshas been renamed toangularjs-fusioncharts.
Install angularjs-fusioncharts wrapper using following command:
npm install angularjs-fusioncharts --saveangular2-fusionchartshas been renamed toangular-fusioncharts.
Install angular-fusioncharts wrapper using following command:
npm install angular-fusioncharts --saveangular4-fusionchartshas been renamed toangular-fusioncharts.
Install angular-fusioncharts wrapper using following command:
npm install angular-fusioncharts --saveUpdated FusionCharts Suite XT Download Package
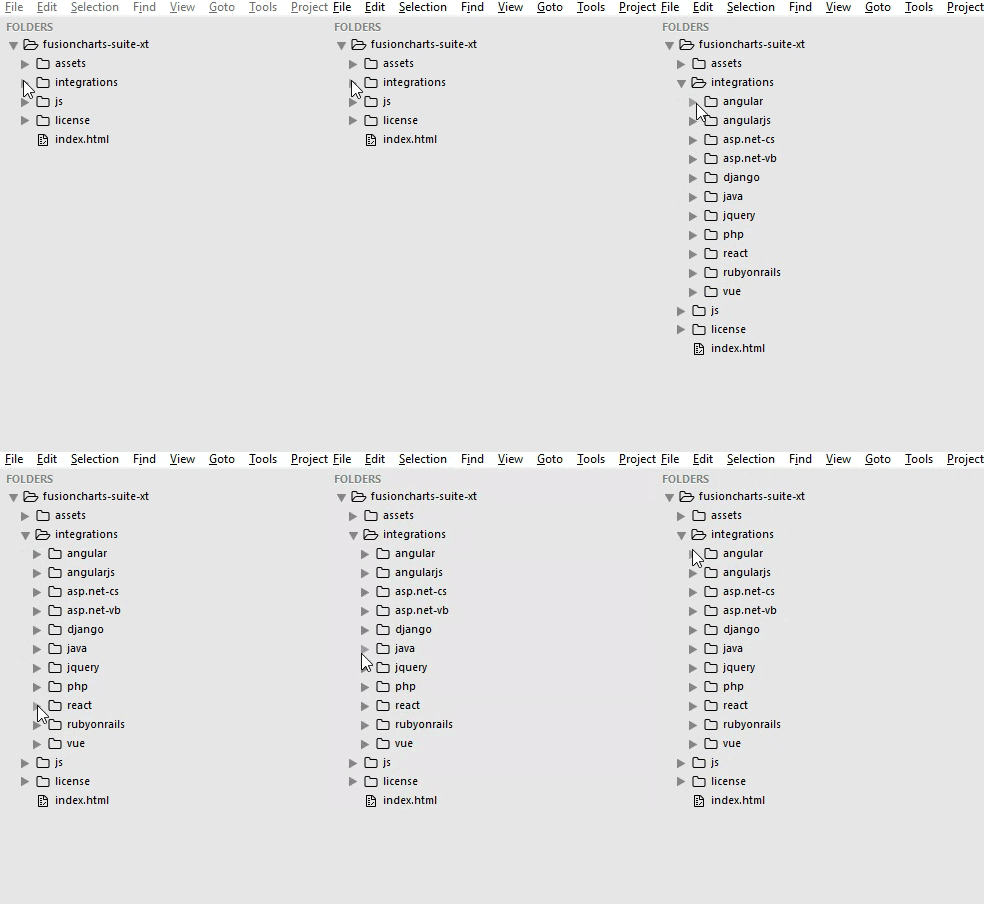
Since, v3.13.0 the FusionCharts Suite XT download package folder structure is updated. The downloaded package will now contain a folder named integrations. This folder consists all the front end and server side wrappers under respective folders with their native export handlers if applicable. The folder structure of the downloaded package is shown below:

Removed Attributes and Methods
Following are the list of attributes which have been removed from the FusionCharts XT Suite:
AnnrenderdelaybtnTextColorbtnFontSizeformBtnWidthformBtnBorderColorformBtnBgColorbtnPaddingbtnSpacingrestoreBtnWidthrestoreBtnBorderColorrestoreBtnBgColorclickBubblesThe deprecated methods
getXML()&setDataXML()have been removed.The deprecated method
setCurrentRenderer()has been removed.The method
getChartFromId()has been removed. UsegetObjectReference()instead.The method
getMapFromId()has been removed. UsegetObjectReference()instead.
Deprecated
The Fusioncharts CJS module for npm has been deprecated.
showFormBtn(deprecated)formBtnTitle(deprecated)showRestoreBtn(deprecated)restoreBtnTitle(deprecated)setTransparent()method is deprecated. UsecontainerBackgroundOpacityinstead.refproperty is deprecated. UsegetObjectReference()instead.dataXMLInvalidevent is deprecated. UsedataInvalidinstead.