Titles and Axis Names
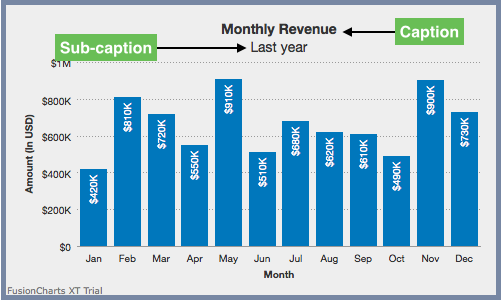
The caption (also called the chart title) is the heading of your chart, whereas a sub-caption is the text that appears just below the caption. In the sections below, you can see how to add a caption, subcaption, x-axis name, and y-axis name to your charts, as well as configure their font properties.
Cartesian charts have axes that run along the left and the bottom borders of the canvas. The x-axis runs along the bottom border of the canvas, running from left to right. The y-axis runs along the left border of the canvas, going from the bottom and to the top.
Set the Caption and Subcaption
Specify the caption of the chart using the
captionattribute, which accepts text values.Specify the sub-caption of the chart using the
subCaptionattribute, which accepts text values.
Refer to the code given below:
{
    "chart": {
        "caption": "Monthly Revenue",
        "subCaption": "Last year"
    }
}The chart will look like as shown below:
Click here to edit the above chart.
Customize Font Properties
Use the following attributes to customize the font color, size, formatting, etc., of the caption.
Set the caption font family using the
captionFontattribute.Set the caption font color in hex code using the
captionFontColorattribute.Set the caption font size (between
0and72) using thecaptionFontSizeattribute.Set caption font to bold by setting the value of the
captionFontBoldattribute to1.
Refer to the code given below:
{
    "chart": {
        "captionFont": "Arial",
        "captionFontSize": "18",
        "captionFontColor": "#993300",
        "captionFontBold": "1"
    }
}To customize the font color, size, formatting, etc., of the subcaption, use the following attributes:
Set the subcaption font family using the
subCaptionFontattribute.Set the subcaption font color in hex code using the
subCaptionFontColorattribute.Set the subcaption font size (between
0and72) using thesubCaptionFontSizeattribute.Set subcaption font to bold by setting the value of the
subCaptionFontBoldattribute to1.
Refer to the code given below:
{
    "chart": {
        "subcaptionFont": "Arial",
        "subcaptionFontSize": "14",
        "subcaptionFontColor": "#993300",
        "subcaptionFontBold": "0"
    }
}The chart with customized caption and subcaption looks like as shown below:
Click here to edit the above chart.
Configure Caption Alignment
Use the following attributes to configure caption alignment:
Specify the horizontal alignment of the caption using the
captionAlignmentattribute, which accepts the values ofleft,center(default), andright.Display the caption at the top of the chart by setting the value of the
captionOnTopattribute to1.Align the caption with the canvas area instead of the chart area, by setting the value of the
alignCaptionWithCanvasattribute to1.Configure the padding (in pixels) from either edge when the caption is not center aligned, using the
captionHorizontalPaddingattribute.
Refer to the code given below:
{
    "chart": {
        "alignCaptionWithCanvas": "1",
        "captionHorizontalPadding": "2",
        "captionOnTop": "0",
        "captionAlignment": "right"
    }
}The chart will look like as shown below:
Click here to edit the above chart.
Setting Axes Names
Use the following attributes to configure names of axes:
Specify the title of the X-axis of the chart using the
xAxisNameattribute.Specify the title of the Y-axis of the chart using the
yAxisNameattribute.
Refer to the code given below:
{
    "chart": {
        "xAxisName": "Quarter",
        "yAxisName": "Amount {br}(In USD)"
    }
}The chart will look like as shown below:
Click here to edit the above chart.
Configure Font Cosmetic Properties
Configure cosmetic properties like font, color, and size of the X-axis name using the attributes given below:
Set the font family of X-axis using the
xAxisNameFontattribute.Set the font color of the X-axis in hex code using the
xAxisNameFontColorattribute.Set the font size (between
0and72) of the X-axis using thexAxisNameFontSizeattribute.Set the font style to bold of the X-axis using the
xAxisNameFontBoldattribute.Set the font style to italic of the X-axis using the
xAxisNameFontItalicattribute.
Refer to the code given below:
{
    "chart": {
        "xAxisNameFont": "Arial",
        "xAxisNameFontSize": "12",
        "xAxisNameFontColor": "#993300",
        "xAxisNameFontBold": "1",
        "xAxisNameFontItalic": "1"
    }
}Configure cosmetic properties like font, color, and size of the Y-axis name using the attributes given below:
Set the font family of Y-axis using the
yAxisNameFontattribute.Set the font color of the Y-axis in hex code using the
yAxisNameFontColorattribute.Set the font size (between
0and72) of the Y-axis using theyAxisNameFontSizeattribute.Set the font style to bold of the Y-axis using the
yAxisNameFontBoldattribute.Set the font style to italic of the Y-axis using the
yAxisNameFontItalicattribute.
Refer to the code given below:
{
    "chart": {
        "yAxisNameFont": "Arial",
        "yAxisNameFontSize": "12",
        "yAxisNameFontColor": "#993300",
        "yAxisNameFontBold": "1",
        "yAxisNameFontItalic": "1"
    }
}The chart will look like as shown below:
Click here to edit the above chart.
Configure Cosmetic Properties of Borders of the Names
Use the following attributes to configure cosmetic properties of the borders around names of x-axis:
Set the border color of the name of the X-axis in hex code using the
xAxisNameBorderColorattribute.Set the transparency (between
0for transparent and100for opaque) of the border around the name of the X-axis using thexAxisNameBorderAlphaattribute.Set the padding of the border (in pixels) around the name of the X-axis using the
xAxisNameBorderPaddingattribute.Set the radius of the border (in pixels) around the name of the X-axis using the
xAxisNameBorderRadiusattributeSet the thickness of the border (in pixels) around the name of the X-axis using the
xAxisNameBorderThicknessattribute.Make the border around the name of the X-axis dashed using the
xAxisNameBorderDashedattribute.Set the length of each dash (in pixels) in the dashed border around the name of the X-axis using the
xAxisNameBorderDashLenattribute.Set the gap between two consecutive dashes (in pixels) in the dashed border around the name of the X-axis using the
xAxisNameBorderDashGapattribute.
Refer to the code given below:
{
    "chart": {
        "xAxisNameBorderColor": "#6666FF",
        "xAxisNameBorderAlpha": "50",
        "xAxisNameBorderPadding": "6",
        "xAxisNameBorderRadius": "3",
        "xAxisNameBorderThickness": "2",
        "xAxisNameBorderDashed": "1",
        "xAxisNameBorderDashLen": "4",
        "xAxisNameBorderDashGap": "2"
    }
}Use the following attributes to configure cosmetic properties of the borders around names of y-axis:
Set the border color of the name of the X-axis in hex code using the
yAxisNameBorderColorattribute.Set the transparency (between
0for transparent and100for opaque) of the border around the name of the X-axis using theyAxisNameBorderAlphaattribute.Set the padding of the border (in pixels) around the name of the X-axis using the
yAxisNameBorderPaddingattribute.Set the radius of the border (in pixels) around the name of the X-axis using the
yAxisNameBorderRadiusattribute.Set the thickness of the border (in pixels) around the name of the X-axis using the
yAxisNameBorderThicknessattribute.Make the border around the name of the X-axis dashed using the
yAxisNameBorderDashedattribute.Set the length of each dash (in pixels) in the dashed border around the name of the X-axis using the
yAxisNameBorderDashLenattribute.Set the gap between two consecutive dashes (in pixels) in the dashed border around the name of the X-axis using the
yAxisNameBorderDashGapattribute.
Refer to the code given below:
{
    "chart": {
        "yAxisNameBorderColor": "#6666FF",
        "yAxisNameBorderAlpha": "50",
        "yAxisNameBorderPadding": "6",
        "yAxisNameBorderRadius": "3",
        "yAxisNameBorderThickness": "2",
        "yAxisNameBorderDashed": "1",
        "yAxisNameBorderDashLen": "4",
        "yAxisNameBorderDashGap": "2"
    }
}The chart will look like as shown below:
Click here to edit the above chart.
Configure the Font Opacity and Background
Use the following attributes to configure the background for names of x-axis:
Set the font family of x-axis name using
xAxisNameFontattribute.Set the x-axis name font size (between
0and72) usingxAxisNameFontSizeattribute.Set the transparency (between
0for transparent and100for opaque) of the name of the x-axis using thexAxisNameFontAlphaattribute.Set the background color (in hex code) of the name of the x-axis using the
xAxisNameBgColorattribute.Set the transparency (between
0for transparent and100for opaque) of the background of the name of the x-axis using thexAxisNameBgAlphaattribute.Set the transparency (between
0for transparent and100for opaque) of the name of the x-axis using thexAxisNameAlphaattribute.
Refer to the code given below:
{
    "chart": {
        "xAxisNameFont": "Arial",
        "xAxisNameFontSize": "14",
        "xAxisNameBgColor": "#3399ff",
        "xAxisNameBgAlpha": "20",
        "xAxisNameFontAlpha": "50",
        "xAxisNameBorderPadding": "10"
    }
}Use the following attributes to configure the background for names of y-axis:
Set the font family of X-axis name using
yAxisNameFontattribute.Set the x-axis name font size (between
0and72) usingyAxisNameFontSizeattribute.Set the transparency (between
0for transparent and100for opaque) of the name of the X-axis using theyAxisNameFontAlphaattribute.Set the background color (in hex code) of the name of the X-axis using the
yAxisNameBgColorattribute.Set the transparency (between
0for transparent and100for opaque) of the background of the name of the X-axis using theyAxisNameBgAlphaattribute.Set the transparency (between
0for transparent and100for opaque) of the name of the X-axis using theyAxisNameAlphaattribute.
Refer to the code given below:
{
    "chart": {
        "yAxisNameFont": "Arial",
        "yAxisNameFontSize": "14",
        "yAxisNameBgColor": "#3399ff",
        "yAxisNameBgAlpha": "20",
        "yAxisNameFontAlpha": "50",
        "yAxisNameBorderPadding": "10"
    }
}The chart will look like as shown below:
Click here to edit the above chart.
Configure Font Properties for Y-axis Names
Use the following attributes to configure font properties of a multi-series combination 2D chart with the primary and secondary y-axis names italicized:
Set the titles of the primary and secondary axes using the
pYAxisNameandsYAxisNameattributes, respectively.Set the fonts of the primary and secondary axes using the
pYAxisNameFontandsYAxisNameFontattributes, respectively.Set the font colors (in hex codes) for the primary and secondary axes using the
pYAxisNameFontColorandsYAxisNameFontColorattributes, respectively.Set the font sizes (between
0and72) for the primary and secondary axes using thepYAxisNameFontSizeandsYAxisNameFontSizeattributes, respectively.Set the fonts for the primary and secondary axes to bold using the
pYAxisNameFontBoldandsYAxisNameFontBoldattributes (set both to1), respectively.Set the fonts for the primary and secondary axes to italic using the
pYAxisNameFontItalicandsYAxisNameFontItalicattributes (set both to1), respectively.Set the degree of transparencies of the primary and secondary axes' name fonts and backgrounds (between
0for transparent and100for opaque) using thepYAxisNameFontAlphaandsYAxisNameFontAlphaattributes, respectively.
Refer to the code given below:
{
    "chart": {
        "pYAxisName": "Amount (In USD)",
        "sYAxisName": "Profit %",
        "pYAxisNameFont": "Arial",
        "pYAxisNameFontSize": "12",
        "pYAxisNameFontColor": "#003366",
        "pYAxisNameFontBold": "1",
        "pYAxisNameFontItalic": "1",
        "pYAxisNameFontAlpha": "50",
        "sYAxisNameFont": "Arial",
        "sYAxisNameFontSize": "12",
        "sYAxisNameFontColor": "#003366",
        "sYAxisNameFontBold": "1",
        "sYAxisNameFontItalic": "1",
        "sYAxisNameFontAlpha": "50"
    }
}The chart will look like as shown below:
Click here to edit the above chart.
Configure Background Properties of Y-axis Names
Use the following attributes to set a semi-transparent background in a chosen color for the primary and secondary y-axis names of a multi-series, combination 2D chart:
Set the degrees of transparencies of the primary and secondary axes' names (between
0for transparent and100for opaque) using thepYAxisNameAlphaandsYAxisNameAlphaattributes, respectively.Set the background colors for the primary and secondary axes' names in hex codes using the
pYAxisNameBgColorandsYAxisNameBgColorattributes, respectively.Set the degrees of transparencies of the primary and secondary axes' name backgrounds (between
0for transparent and100for opaque) using thepYAxisNameBgAlphaandsYAxisNameBgAlphaattributes, respectively.
Refer to the code given below:
{
    "chart": {
        "pYAxisNameBgColor": "#3399ff",
        "pYAxisNameBgAlpha": "20",
        "pYAxisNameBorderPadding": "6",
        "pYAxisNameAlpha": "50",
        "sYAxisNameFont": "Arial",
        "sYAxisNameFontSize": "12",
        "sYAxisNameBgColor": "#3399ff",
        "sYAxisNameBgAlpha": "20",
        "sYAxisNameBorderPadding": "6",
        "sYAxisNameAlpha": "50"
    }
}The chart will look like as shown below:
Click here to edit the above chart.
Configure the Border Properties of Y-axis Names
Use the following attributes to customize the primary and secondary y-axis names for a multi-series, combination 2D chart with a dashed border and a chosen color:
Set the background colors for the primary and secondary axes' name borders in hex codes using the
pYAxisNameBorderColorandsYAxisNameBorderColorattributes, respectively.Set the degrees of transparencies of the primary and secondary axes' name borders (between
0for transparent and100for opaque) using thepYAxisNameBorderAlphaandsYAxisNameBorderAlphaattributes, respectively.Set the border padding (in pixels) for the primary and secondary axes' names using the
pYAxisNameBorderPaddingandsYAxisNameBorderPaddingattributes, respectively.Set the border radius (in pixels) for the primary and secondary axes' names using the
pYAxisNameBorderRadiusandsYAxisNameBorderRadiusattributes, respectively.Set the border thickness (in pixels) for the primary and secondary axes' names using the
pYAxisNameBorderThicknessandsYAxisNameBorderThicknessattributes, respectively.Make the name borders for the primary and secondary axes' names dashed using the
pYAxisNameBorderDashedandsYAxisNameBorderDashedattributes (set both to1), respectively.Set the length of each dash (in pixels) for the dashed borders around primary and secondary axes' names using the
pYAxisNameBorderDashLenandsYAxisNameBorderDashLenattributes, respectively.Set the gap between two consecutive dashes (in pixels) for the dashed borders around primary and secondary axes' names using the
pYAxisNameBorderDashGapandsYAxisNameBorderDashGapattributes, respectively.
Refer to the code given below:
{
    "chart": {
        "pYAxisNameBorderColor": "#6666FF",
        "pYAxisNameBorderAlpha": "50",
        "pYAxisNameBorderPadding": "6",
        "pYAxisNameBorderRadius": "0",
        "pYAxisNameBorderThickness": "1",
        "pYAxisNameBorderDashed": "1",
        "pYAxisNameBorderDashLen": "4",
        "pYAxisNameBorderDashGap": "2",
        "sYAxisNameBorderColor": "#6666FF",
        "sYAxisNameBorderAlpha": "50",
        "sYAxisNameBorderPadding": "6",
        "sYAxisNameBorderRadius": "0",
        "sYAxisNameBorderThickness": "1",
        "sYAxisNameBorderDashed": "1",
        "sYAxisNameBorderDashLen": "4",
        "sYAxisNameBorderDashGap": "2",
    }
}The chart will look like as shown below:
Click here to edit the above chart.