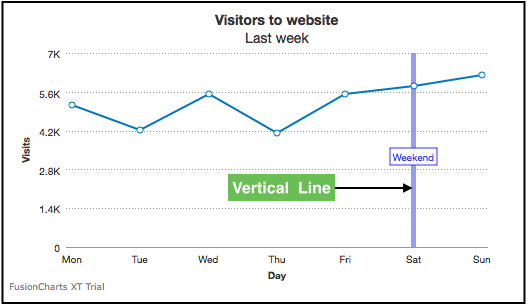
Vertical Lines
Vertical (or horizontal in case of bar charts) separator lines or vlines are elements that can help differentiate between data blocks in a chart. They can be placed between any two data points, or aligned to specific data points.
Set Vertical Lines
By default, the vertical lines do not appear. To display a vertical line follow the steps below:
Create an object under
databetween the data values where you want to render the vertical line.Set the
vLineattribute to1.Specify the display text of the vertical line using the
labelattribute.Set the position of the vertical line using the
linePositionattribute.
Refer to the code below:
{
    "chart": {
       ...
    },
    "data": [{
        "label": "Fri",
        "value": "5529"
    },
    {
        "vline": "true",
        "label": "Weekend Start",
        "linePosition": "0.7"
    },
    {
        "label": "Sat",
        "value": "5803"
    },
    {
        "label": "Sun",
        "value": "6202"
    }]
}The chart will look like as shown below:
Click here to edit the above chart.
Configure Label Positions
To set the position of the label, specify the position using the labelPosition attribute. Refer to the code below:
{
    "chart": {
        ...
    },
    "data": [{
        "label": "Fri",
        "value": "5529"
    },
    {
        "vline": "true",
        "label": "Weekend Start",
        "linePosition": "0.7",
        "labelPosition": "0.5"
    },
    {
        "label": "Sat",
        "value": "5803"
    },
    {
        "label": "Sun",
        "value": "6202"
    }]
}The chart will look like as shown below:
Click here to edit the above chart.
Configure Label Alignment
To configure the alignment of the label, the following attributes are used:
Set the horizontal alignment of the label using the
labelHAlignattribute. The possible values for this attribute areleft,center(default), andright.Set the vertical alignment of the label using the
labelVAlignattribute. The possible values for this attribute aretop,middle(default), andbottom.
Refer to the code below:
{
    "chart": {
        ...
    },
    "data": [{
        "label": "Fri",
        "value": "5529"
    },
    {
        "vline": "true",
        "label": "Weekend Start",
        "linePosition": "0.7",
        "labelPosition": "0.5",
        "labelVAlign": "middle",
        "labelHAlign": "right"
    },
    {
        "label": "Sat",
        "value": "5803"
    },
    {
        "label": "Sun",
        "value": "6202"
    }]
}The chart will look like as shown below:
Click here to edit the above chart.
Show Label Borders
To add borders to the label set the showVLineLableBorder to 1 within the chart object. This attribute is used to show borders for the labels of all the vertical lines.
Refer to the code below:
{
    "chart": {
        "showVLineLabelBorder": "1"
    },
    "data": [{
        "label": "Fri",
        "value": "5529"
    },
    {
        "vline": "true",
        "label": "Weekend Start",
        "linePosition": "0.7",
        "labelPosition": "0.5",
        "labelVAlign": "middle",
        "labelHAlign": "right"
    },
    {
        "label": "Sat",
        "value": "5803"
    },
    {
        "label": "Sun",
        "value": "6202"
    }]
}The chart will look like as shown below:
Click here to edit the above chart.
In order to show label borders for specific vertical lines, set the showLabelBorder attribute to 1 for a particular vertical line under data. This attribute overrides the setting in the chart object.
Refer to the code below:
{
    "chart": {
        ...
    },
    "data": [{
        "label": "Fri",
        "value": "5529"
    },
    {
        "vline": "true",
        "label": "Weekend Start",
        "linePosition": "0.7",
        "labelPosition": "0.5",
        "labelVAlign": "middle",
        "labelHAlign": "right",
        "showLabelBorder": "1"
    },
    {
        "label": "Sat",
        "value": "5803"
    },
    {
        "label": "Sun",
        "value": "6202"
    }]
}The chart will look like as shown below:
Click here to edit the above chart.
Customize Visual Properties
To customize the visual properties of the vertical line, the following attributes are used:
Specify the hex code for the color of the vertical line using the
colorattribute.Set the thickness (in pixels) of the vertical line using the
thicknessattribute.Set the transparency of the vertical line using the
alphaattribute.Set the
dashedattribute to1to view the vertical line as dashed.Specify the length of each dash using the
dashLenattribute.Set the gap between each dash using the
dashGapattribute.
Refer to the code below:
{
    "chart": {
        ...
    },
    "data": [{
        "label": "Fri",
        "value": "5529"
    },
    {
        "vline": "true",
        "label": "Weekend Start",
        "linePosition": "0.7",
        "labelPosition": "0.5",
        "labelVAlign": "middle",
        "labelHAlign": "right"
        "color": "#6da81e",
        "thickness": "2",
        "alpha": "50",
        "dashed": "1",
        "dashLen": "4",
        "dashGap": "2"
    },
    {
        "label": "Sat",
        "value": "5803"
    },
    {
        "label": "Sun",
        "value": "6202"
    }]
}The chart will look like as shown below:
Click here to edit the above chart.