Vertical Div Lines
Vertical divisional (or div) lines are vertical lines running through the canvas in a chart.
Vertical div lines are applicable only for the line, area, spline, splineArea, and XY type charts.
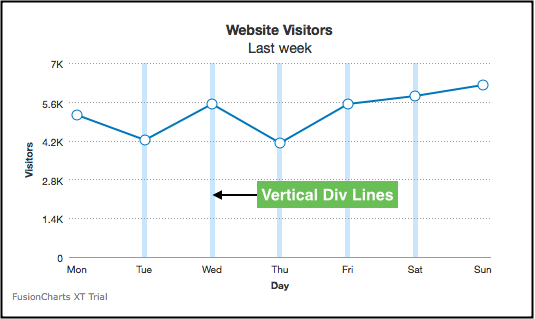
The image below shows vertical div lines rendered in a line chart:
Show Vertical Divisional Lines
By default, vertical divisional lines are not rendered in a chart. To render vertical divisional lines, specify the number of divisional lines you want to display using the numVDivLines attribute.
Refer to the code below:
{
    "chart": {
        "numVDivLines": "5"
    }
}The chart will look like as shown below:
Click here to edit the above chart.
Customize the Visuals of Vertical Divisional Lines
To customize the visuals of the divisional lines use the following attributes:
Specify the hex code of for the divisional line color using the
vDivLineColorattribute.Set the thickness (in pixels) using the
vDivLineThicknessattribute.Set the transparency of the using the
vDivLineAlphaattribute.
Refer to the code below:
{
    "chart": {
        "numVDivLines": "5",
        "vDivLineColor": "#99ccff",
        "vDivLineThickness": "1",
        "vDivLineAlpha": "50"
    }
}The chart will look like as shown below:
Click here to edit the above chart.
Dashed Divisional Lines
You can also render div lines as dashed lines instead of the default continuous lines. To do so, use the following attributes:
Set the
vDivLineDashedattribute to1to view the divisional lines as dashed.Set the length of each dashed line using the
vDivLineDashLenattribute.Set the gap between each dash using the
vDivLineDashGapattribute.
Refer to the code below:
{
    "chart": {
        "numVDivLines": "5",
        "vDivLineColor": "#99ccff",
        "vDivLineThickness": "1",
        "vDivLineAlpha": "70",
        "vDivLineDashed": "1",
        "vDivLineDashLen": "5",
        "vDivLineDashGap": "3"
   }
}The chart will look like as shown below:
Click here to edit the above chart.
Show Vertical Grid Bands
Vertical grid bands, by default, do not appear between the vertical divisional lines.
To show the vertical grid bands, set the showAlternateVGridColor attribute to 1.
Refer to the code below:
{
    "chart": {
        "showAlternateVGridColor": "1"
    }
}A line chart with alternate vertical grid bands enabled is shown below:
Click here to edit the above chart.
Customize the Visuals Vertical Grid Bands
To customize the visual properties of the vertical grid bands use the following attributes:
Specify the hex code for the color of the grid bands using the
alternateVGridColorattribute.Set the transparency of the grid band using the
alternateVGridAlphaattribute.
Refer to the code below:
{
    "chart": {
        "alternateVGridColor": "#bee6ff",
        "alternateVGridAlpha": "30"
    }
} The chart will look like as shown below:
Click here to edit the above chart.