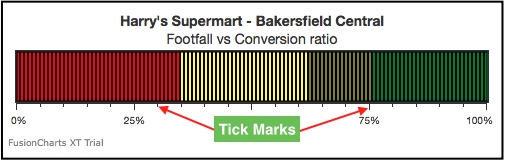
Tick Marks
Tick marks, an element of gauges in FusionChart Suite XT, are calibration marks on the scale to help interpret readings. There are two types of tick marks:
Major Tick Marks – The bigger lines on the radial scale
Minor Tick Marks – The smaller lines interspersed within the major tick marks
An LED gauge with major and minor tick marks looks like this:
Show/Hide Tick Marks
By default, the tick marks are displayed. To hide the tick marks set the showTickMarks attribute to 1. Refer to the code below:
{
    "chart": {
        "showTickMarks": "0"
    }
}An LED gauge will look like as shown below:
Click here to edit the above chart.
Show/Hide the Tick Values
By default, the tick values are displayed. To hide the tick values set the showTickValues attribute to 1. Refer to the code below:
{
    "chart": {
        "showTickValues": "0"
    }
}An LED gauge will look like as shown below:
Click here to edit the above chart.
You can also opt to hide the upper and lower limits of the gauge. To do so, set the showLimits attribute to 0.
Refer to the code below:
{
    "chart": {
        "showLimits": "0"
    }
}An LED gauge will look like as shown below:
Click here to edit the above chart.
Configure the Tick Value Position
By default, tick marks and tick values are placed outside a gauge. In vertical gauges (like the vertical LED gauge), they are placed to the right of the gauge by default. Similarly, in horizontal gauges (like the horizontal LED gauge), they are placed below the gauge.
To customize the position of tick marks and tick values use the following attributes:
Set the
placeTicksInsideto1to view the tick marks inside the gauge.Set the
placeValuesInsideto1to view the tick values inside the gauge.
Refer to the code below:
{
    "chart": {
        "placeTicksInside": "1",
        "placeValuesInside": "1"
    }
}An angular gauge will look like as shown below:
Click here to edit the above chart.
Tick Value Position of Horizontal Gauges
To customize the position of tick marks and tick values of a horizontal use the following attributes:
- Set the
ticksBelowGaugeto0to view the tick marks above the gauge.
Refer to the code below:
{
    "chart": {
        "ticksBelowGauge": "0"
    }
}A horizontal gauge will look like as shown below:
Click here to edit the above chart.
Tick Value Position of Vertical Gauges
To customize the position of tick marks and tick values of a vertical gauge use the following attributes:
- Set the
ticksOnRightto1to view the tick marks at the right of the gauge. In case of the vertical gauge, the tick marks get rendered above the gauge.
Refer to the code below:
{
    "chart": {
        "ticksOnRight": "1"
    }
}A vertical gauge will look like as shown below:
Click here to edit the above chart.
Display every nth Tick Mark Value
FusionCharts allows you to show every n-th value, where the upper and lower limit of the scale is always displayed.
To do so, specify the n-th tick value using the tickValueStep attribute.
Refer to the code below:
{
    "chart": {
        "tickValueStep": "2"
    }
}A horizontal LED gauge displaying n-th value looks as below:
Click here to edit the above chart.
Show Tick Values in Decimals
You can configure the number of decimals and can also force the number of decimals on tick values.
To do so, the following attributes are used:
Specify the number of decimals to which tick values will be rounded to using the
tickValuDecimalsattribute.Set the
forceTickValueDecimalsattribute to1to force the number of decimals on tick values.
Refer to the code below:
{
    "chart": {
        "tickValueDecimals": "3",
        "forceTickValueDecimals":"1"
    }
}The chart will look like as shown below:
Click here to edit the above chart.
Configure Tick Mark and Tick Value Padding
By defining the padding for tick mark and tick value, you can control the amount of space between the tick mark and the gauge, or between the tick values and tick marks.
To do so, use the following attributes:
Set the distance (in pixels) between the gauge and the tick marks using the
tickMarkDistanceattribute.Set the distance (in pixels) between the tick values and tick marks using the
tickValueDistanceattribute.
Refer to the code below:
{
    "chart": {
        "tickMarkDistance": "10",
        "tickValueDistance": "10"
    }
}A horizontal LED gauge will look like as shown below:
Click here to edit the above chart.
Set the Number of Major and Minor Tick Marks
By default, the number of major and minor ticks are automatically adjusted. You can opt to define the number of major and minor tick marks to be rendered on a gauge. To do so, the following attributes are used:
Set the
adjustTMattribute to '0' to disable the automatic adjustment of the tick marks.Specify the number of major tick marks using the
majorTMNumberattribute.Specify the number of minor tick marks using the
minorTMNumberattribute.
Refer to the code below:
{
    "chart": {
        "adjustTM": "0",
        "majorTMNumber": "11",
        "minorTMNumber": "4"
    }
}A horizontal LED gauge will look like as shown below:
Click here to edit the above chart.
Configure Visuals of Tick Marks
You can configure the color, transparency, height, and thickness of both, major and minor tick marks.
To do so, use the following attributes:
Specify the hex code for the major ticks color using the
majorTMColorattribute.Specify the hex code for the minor ticks color using the
minorTMColorattribute.Set the transparency of the major ticks using the
majorTMAlphaattribute.Set the transparency of the minor ticks using the
minorTMAlphaattribute.Set the height of the major ticks using the
majorTMHeightattribute.Set the height of the minor ticks using the
minorTMHeightattribute.Set the thickness of the major ticks using the
majorTMThicknessattribute.Set the thickness of the minor ticks using the
minorTMThicknessattribute.
Refer to the code below:
{
    "chart": {
        "majorTMColor": "#666666",
        "majorTMAlpha": "70",
        "majorTMHeight": "10",
        "majorTMThickness": "2",
        "minorTMColor": "#cccccc",
        "minorTMAlpha": "100",
        "minorTMHeight": "6",
        "minorTMThickness": "1"
    }
}A horizontal LED gauge will look like as shown below:
Click here to edit the above chart.