Legend
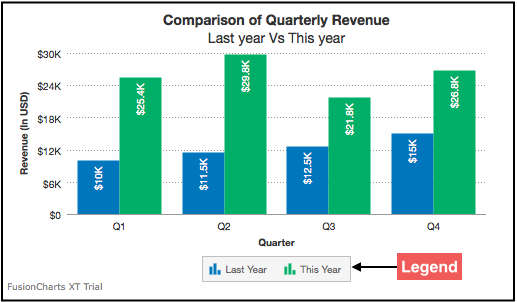
A legend is a chart element used to display the series name for each dataset, in case of multi-series or combination charts. Legends are used to correlate a data plot to its series name using its color.
Legends are not applicable to single series charts.
In the following image, the legend rendered below the x-axis helps identify the data plots corresponding to a series name. Each series is represented by its own icon in the legend.
Show/Hide the Legends
To show/hide the legends, set the showLegend attribute to 1/0. The default value of this attribute is 1.
Refer to the code below:
{
    "chart": {
        "showLegend": "1"
    }
}The chart will look as shown below:
Click here to edit the above chart.
In the chart shown above, when you click the legend icon for Last Year, all data plots in blue, (showing the quarterly revenue for the last year) are hidden.
Show/Hide Data Plots via the Legend
With FusionCharts Suite XT, show/hide the data plots belonging to a data series by clicking the corresponding legend icon. The legend interaction can also be disabled using interactiveLegend attribute. The default value of this attribute is 1. Let's check out a sample without the interactive legend.
Refer to the code below:
{
    "chart": {
        "interactiveLegend": "0"
    }
}The chart will look as shown below:
Click here to edit the above chart.
Highlight a Data Series via the Legend
Hover the mouse pointer over a legend text to highlight corresponding data plots in the chart. Whenever you do this, the chart reduces the opacity of the data plots belonging to other data series, making the one you hover on stand out prominently.
To enable this feature, set the plotHighlightEffect attribute to fadeout.
Refer to the code below:
{
    "chart": {
        "plotHighlightEffect": "fadeout"
    }
}The chart will look as shown below:
Click here to edit the above chart.
In the chart shown above, when the mouse pointer hovers over the legend text This Year, the data plots in blue (corresponding to Last Year) fade out, and the data plots in green (corresponding to This Year) are highlighted.
Customize the Highlight Effect
Instead of just reducing the opacity of the data plots that don't correspond to the hovered over legend text, you can customize a different effect.
Define plotHighlightEffect attribute in the following format, to customize the highlight effect:
plotHighlightEffect=effectName|confStr
Always set effectName to fadeout. Use confStr, a comma-separated list of customization properties for the effect. Use the following attributes to see the difference:
Specify the hex code for the data plot fill color using the
colorattribute.Specify the transparency of the data plots using the
alphaattribute.
Refer to the code below:
{
    "chart": {
        "plotHighlightEffect": "fadeout|color=#7f7f7f, alpha=60"
    }
}The chart will look as shown below:
Click here to edit the above chart.
In the above chart, when you hover the mouse pointer over the legend text This Year, data plots belonging to the Last Year data series are grayed out.
For the above chart, the attribute has been defined as shown below:
"plotHighlightEffect": "fadeout|color=#7f7f7f, alpha=60"
Use the following attributes to customize the border while highlight effect is set:
Specify the hex code for the plot border color using the
borderColorattribute.Specify the transparency of the plot border using the
borderAlphaattribute. If you don't include this attribute into the configuration string, then it takes the value assigned to the attributealpha(in the configuration string, as shown above).
Refer to the code below:
{
    "chart": {
        "showplotBorder": "1",
        "plotHighlightEffect": "fadeout|borderColor=ff0000, borderAlpha=50"
    }
}Click here to edit the above chart.
Use the following attributes to customize the background of the anchor:
Specify the hex code for the anchor background color using the
anchorBgColorattribute. If you don't include this attribute into the configuration string, then it takes the value assigned to the attributecolor(in the configuration string, as shown above).Specify the transparency of the anchor background using the
anchorBgAlphaattribute.
Refer to the code below:
{
    "chart": {
        "plotHighlightEffect": "fadeout|anchorBgColor=ff0000, anchorBgAlpha=50"
    }
}Click here to edit the above chart.
The attributes to customize the values of highlight effect are:
Specify the hex code for the data value background color using the
valueBgColorattribute.Specify the hex code for the data value border color using the
valueBorderColorattribute.Specify the hex code for the data value font color using the
valueFontColorattribute. If you don't include this attribute into the configuration string, then it takes the value assigned to the attributecolor(in the configuration string, as shown above).
Refer to the code below:
{
    "chart": {
        "showplotBorder": "1",
        "plotHighlightEffect": "fadeout|alpha=60, valueBgColor=#ff0000, valueBorderColor=#3a4660, valueFontColor=#000000"
    }
}Click here to edit the above chart.
Set the Legend Position
Use the following attributes to set legend position:
Specify the position of the legend using the
legendPositionattribute. You can either set it below the chart for valuebottomor to the right of the chart for valueright.Set the
legendAllowDragattribute to1to make the legend draggable.
Refer to the code below:
{
    "chart": {
        "legendPosition": "right",
        "legendAllowDrag": "1"
    }
}The chart will look as shown below:
Click here to edit the above chart.
Configure Legend Icon Size
Specify the legend icon size using the legendIconScale attribute. You can control the size of legend icon with values from 1 (100%) to 5 (500%).
Refer to the code below:
{
    "chart": {
        "legendIconScale": "2"
    }
}The chart will look as shown below:
Click here to edit the above chart.
Draw a Custom Legend Icon Shape
Use the following attributes to draw a custom legend icon shape:
- Set the
drawCustomLegendIconattribute to1to enable drawing of a custom legend icon. All other legend icon customization attributes work only if you enable this feature.
Refer to the code below:
{
    "chart": {
        "drawCustomLegend":"1"
    }
}By default, the background color of the icons are same as that of the plot colors. Specify the hex color code for the background of the legend icon using the
legendIconBgColorattribute.Set the legend icon transparency using the
legendIconAlphaattribute. It takes values between0(transparent) and100(opaque; default).Set the legend icon background transparency using the
legendIconBgAlphaattribute. It takes values between0(transparent) and100(opaque; default).Set the thickness of the legend icon border using the
legendIconBorderThicknessattribute.Specify the hex color code for the border of the legend icon using the
legendIconBorderColorattribute. By default, it takes the data plot fill color.
Refer to the code below:
{
    "chart": {
        "legendIconBgColor": "#ff0000"
        "legendIconAlpha": "50",
        "legendIconBgAlpha": "30",
        "legendIconBorderColor": "#123456",
        "legendIconBorderThickness": "3"
    }
}Set the number of sides for the legend icon using the
legendIconSidesattribute.Set the starting angle for drawing the legend icon using the
legendIconStartAngleattribute.
Refer to the code below:
{
    "chart": {
        "legendIconSides": "5",
        "legendIconStartAngle": "60"
    }
}The chart will look as shown below:
Click here to edit the above chart.
Customize Legend Scroll Bar
If you have multiple data items in a multi-series chart, the legend automatically displays a scroll bar. Use the legendScrollBgColor attribute to specify the background color of the scroll bar.
Refer to the code below:
{
    "chart": {
        "legendScrollBgColor": "#f0000f"
    }
}The chart will look as shown below:
Click here to edit the above chart.
Reverse Legend Order
Set the value of reverseLegend attribute to 1, to reverse the order of datasets in the legend.
Refer to the code below:
{
    "chart": {
        "reverseLegend": "1"
    }
}The chart will look as shown below:
Click here to edit the above chart.
Hide Data Series upon Loading
Set the value of initiallyHiddenattribute to 1, to hide the data plots of a data series initially, on chart load. The plots will become visible when you click on the name of the series in the legend. This attribute works from the dataset object level in JSON data, and by default takes the value of 0, thereby displaying data plots of every series when you load the chart.
Refer to the code below:
{
    "chart": {
        ...
    },
    "dataset": [{
        "initiallyHidden": "1"
    }]
}The chart will look as shown below:
Click here to edit the above chart.
Customize Legend Appearance
Use the following attributes used to customize legend appearance:
Specify the background color for the legend using the
legendBgColorattribute, which accepts hex codes as values.Specify the background transparency for the legend using the
legendBgAlphaattribute. It takes values between0(transparent) and100(opaque).
Refer to the code below:
{
    "chart": {
        "legendBgColor": "#CCCCCC",
        "legendBgAlpha": "20"
    }
}Specify the border color for the legend using the
legendBorderColorattribute, which accepts hex codes as values.Specify the border thickness for the legend in pixels, using the
legendBorderThicknessattribute.Specify the border transparency for the legend using the
legendBorderAlphaattribute. It takes values between0(transparent) and100(opaque).
Refer to the code below:
{
    "chart": {
        "legendBorderColor": "#666666",
        "legendBorderThickness": "1",
        "legendBorderAlpha": "40",
    }
}Set the value of the
legendShadowattribute to1, to display legend shadow.If you have too many items in the legend, it will automatically display a scroll bar. Specify the background color of the scroll bar using the
legendScrollBgColorattribute, which accepts hex codes.Specify the horizontal alignment of the legend caption with the
legendCaptionAlignmentattribute, which accepts the valuesleft,center, andright.
Refer to the code below:
{
    "chart": {
        "legendCaptionAlignment": "center",
        "legendScrollBgColor": "#ffffff",
        "legendShadow": "1"
    }
}The chart will look as shown below:
Click here to edit the above chart.
Customize Legend Font Cosmetics
Use the following attributes to customize the legend font cosmetics:
Specify the legend item font using the
legendItemFontattribute.Specify the legend item font size using the
legendItemFontSizeattribute, which accepts values between0and72.Specify the legend item font color using the
legendItemFontColorattribute, which accepts hex codes as values.Display legend keys in bold, by setting the value of
legendItemFontBoldattribute to1.
Refer to the code below:
{
    "chart": {
        "legendItemFontBold": "0",
        "legendItemFont": "Arial",
        "legendItemFontSize": "11",
        "legendItemFontColor": "#666666",
    }
}- Specify the legend item font color on hover, using the
legendItemHoverFontColorattribute, which accepts hex codes as values.
Refer to the code below:
{
    "chart": {
        "legendItemHoverFontColor": "#000000"
    }
}Specify the legend caption value using the
legendCaptionattribute, which accepts strings.Specify the legend caption font using the
legendCaptionFontattribute.Specify the legend caption font size using the
legendCaptionFontSizeattribute, which accepts values between0and72.Specify the hex color code for the caption font of the legend using the
legendCaptionFontColorattribute.Set the
legendCaptionBoldattribute to1to make the caption appear bold.
Refer to the code below:
{
    "chart": {
        "legendCaption": "Which year?",
        "legendCaptionBold": "1",
        "legendCaptionFont": "Arial",
        "legendCaptionFontSize": "14",
        "legendCaptionFontColor": "#333333"
    }
}The chart will look as shown below:
Click here to edit the above chart.