DEV CENTER
Chart Explorer
API Reference
FusionCharts Constructor
Events
Methods
Properties
Type Definitions
Global Methods
v3.12.2
v3.13.0
v3.12.2
v3.12.1
v3.12.0
v3.11.3
v3.11.2
v3.11.0
v3.10.1
v3.10.0
v3.9.0
v3.8.0
v3.7.1
v3.7.0
v3.6.0
v3.5.1
v3.5.0
v3.4.1
v3.4.0
DOWNLOAD TRIAL
Home
Installation
Client Side Frameworks
Plain JS
Angular
React
jQuery
Server Side Frameworks
PHP
Ruby on Rails
ASP.NET
Java
Django
Guides
Getting Started
Your First Chart
Your First Widget
Your First Map
Building Dashboards
List of Charts
List of Maps
Using XML as Data Format
Setting Data Source Using URL
Chart Configurations
Size and Type
Border and Background
Canvas
Titles and Axis Names
Data Plot
Data Labels
Data Values
Number Format
Fonts
Chart Palettes
Chart Limits
Div Lines and Grids
Vertical Div Lines
Zero Plane
Trend Lines and Zones
Anchors and Lines
Cross Line
Tooltips
Vertical Lines
Legend
Annotations
Tick Marks
Loading External Logo
Chart Paddings and Margins
Toolbar
Drill-down
Charts
Line, Area and Column Charts
Pie and Doughnut Charts
Multi-Series Charts
Combination Charts
Stacked Charts
Scroll Charts
Bubble and XY Charts
Pareto Charts
Marimekko Charts
Treemap
Heat Map Chart
Gantt Chart
Zoom Line Charts
Drag-able Charts
Select Scatter Chart
Zoom Scatter Chart
Radar Chart
Funnel Chart
Pyramid Chart
Bullet Graphs
Multi-axis Line Chart
Multi-level Pie Chart
Candlestick Chart
Waterfall Chart
Box and Whisker Chart
Error Charts
Spline Charts
Inverse Y Axis Chart
Logarithmic Charts
Step Line Chart
Kagi Chart
Spark Charts
Drag Node Chart
Real-Time Charts
Gauges and Widgets
Angular Gauge
Bulb Gauge
Cylinder Gauge
Led Gauge
Linear Gauge
Thermometer Gauge
Map Guide
Setup
Simple Data Driven Map
Custom Entity IDs
Add Color Based on Data Range
Markers
Listening to Map Events
Add Drill Down to Maps
Map Reference
Marker Data
Specification Sheets
Attribute Reference
Themes
Introduction to Themes
Theme Manager
Create Your Own Themes
Showcase
Chart Gallery
Business Dashboards
Live Examples of Charts
Customizing Charts
Advanced Chart Configurations
Events
Introduction to Events
Handling Events
Classifying Events
Tutorials
Render Thumbnail Versions of Charts
Configure Chart Messages
Chart Attributes
FusionExport
Overview
Installation
Install FusionExport Server
Install FusionExport CLI
Install FusionExport Server SDKs
Tutorials
Export chart as image
Change the export type
Export charts as bulk
Change the export quality
Customize the width and height of an exported chart
Export in bulk using multiple json files
Export the output files as a zip
Override the chart config
Export a dashboard
Add a logo or a heading to the dashboard
Convert an SVG image to PNG/JPEG/PDF
Inject extra JavaScript while exporting
Manipulate the output filename
Add CLI options in a file
Enable logging
Save exported files to S3
Asynchronous capture
Export a D3 chart
FusionExport Server Reference
CLI Reference
SDK API Reference
Node.js
Java
C#
PHP
Python
Golang
Release Notes
Export Using
FusionCharts Export Server
Exporting Charts as Image and PDF
Exporting Chart Data
Modes of Export
Exporting Charts and Chart Data Using the Server-side Export Feature
Exporting Charts and Chart Data Using the Client-side Export Feature
Exporting Charts and Chart Data Using the Auto Export Feature
Logging Export Statistics
Configuring the Export Feature
Setup Private Export Server
ASP.NET
PHP
Java
Ruby on Rails
Exporting Multiple Charts in a Single Image
Architecture of the FusionCharts Export Server
Excel Export
Beta
Overview
Server Side Set-up
Client Side Set-up
Excel Export Workflow
Export charts in Excel
Supported Chart Attributes
API Reference
FusionCharts
Events
Methods
Properties
Type Definitions
Namespaces
Debugger
Ajax
PrintManager
Annotations
Global Methods
Tutorials
Remove an Existing Chart from a Page
Get Reference to Chart Object
FusionCharts Constructor and Object
Change Chart Properties at Runtime
Using Special Characters
Plot Discontinuous Data
Highlight Specific Data Points
View Data of Existing Chart
Get Formatted Numbers Outside Chart
Get SVG Representation of a Chart
Integration with your Stack
Using with Server Side Languages
PHP
Introduction to the FusionCharts PHP Wrapper
Different Ways of Loading Data in PHP
Creating Charts in PHP using a Database
Ruby on Rails
Introduction to the FusionCharts Ruby on Rails Wrapper
Different Ways of Loading Data in Ruby
Creating Charts in Ruby using a Database
ASP.NET
Introduction to the FusionCharts ASP.NET Wrapper
Different Ways of Loading Data in ASP.Net
Creating Charts in ASP.Net using a Database
Creating Drill-down Charts
Java
Introduction to the FusionCharts JSP Wrapper
Different Ways of Loading Data in Java
Creating Charts in Java using a Database
Django
Introduction to the FusionCharts Django Wrapper
Different Ways of Loading Data in Django
Creating Charts in Django using a Database
Tutorials
Create Interactive Charts using PHP and MySQL
Create Drill-Down Charts using PHP and MySQL
Create Charts using Node.js, ExpressJS and Mongodb
Using with JavaScript Libraries
jQuery
Introduction to FusionCharts jQuery Helper
Rendering Charts Using jQuery
Updating Chart Properties Using jQuery
Selecting Charts Using jQuery
Handling Events Using jQuery
Rendering Charts from HTML Tables
API Reference
AngularJS
Introduction to FusionCharts AngularJS Directive
Creating Charts Using the Angular-FusionCharts Directive
Configuring Charts Using the Scope
Configuring Advanced Features Using AngularJS
ReactJS
Introduction to FusionCharts ReactJS Component
Install FusionCharts ReactJS Component via NPM
Creating Charts Using the React-FusionCharts Component
Configuring Charts Using the ReactJS Props Object
Configuring Advanced Features Using ReactJS
Including Interactivity in Charts Using ReactJS
VueJS
Introduction to the FusionCharts VueJS Component
Installing the FusionCharts VueJS Component via NPM
Creating Charts Using the FusionCharts VueJS Component
Configuring Advanced Features Using VueJS
Including Interactivity in Charts Using VueJS
Angular4
Introduction to the FusionCharts Angular4 Component
Installing the FusionCharts Angular4 Component via NPM
Creating Charts Using the FusionCharts Angular4 Component
Configuring Advanced Features Using Angular4
Including Interactivity in Charts Using Angular4
Help
Migration
Upgrade from Evaluation Versions
Upgrade from Previous Versions
What's New in v3.12.2
Deprecated Functionalities in v3.12.2
Troubleshooting
Using the FusionCharts Suite XT Debugger
Want to Install FusionCharts?
Choose a Framework
Plain JS
Angular
React
Vue.js
jQuery
Ruby on Rails
Django
.NET
PHP
Java
Getting Started
Create Your First Chart
Create Your First Gauge and Widget
Create Your First Map
Building A Dashboard
Setting Datasource using URL
Upgrading FusionCharts
Upgrading from evaluation Versions
Upgrading from Previous Versions
What's New in 3.12?
Depricated Functionalities in 3.12.2
Version History
Configuring Charts
Changing the Size and Type
Configuring Tooltips
Configuring Border and Background
Adding Legends to Your Chart
Adding Titles and Axis Names
Guides
Creating Multi-series Charts
Creating Pie and Doughnut Charts
Multi-level Pie Chart
Creating Multi-axis Line Chart
Introduction to Drag-able Chart
What can you do with FusionCharts?
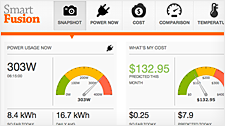
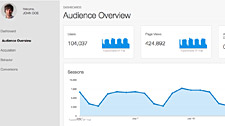
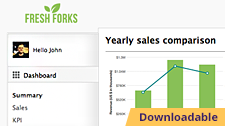
Dashboards
Energy Dashboard
Google Analytics
Management Dashboard
Charts
Composition
Distribution
Comparison