Architecture of the FusionCharts Export Server
So far, you’ve been introduced to the FusionCharts chart export feature (to export charts as images and PDF as well as the chart data in XLS, the different modes of export (server-side, client-side, and auto-export) supported by the suite, and export statistics logging capabilities.
This article will give you an insight into the overall architecture of the FusionCharts Export Server, details and workflow of the individual modules in the architecture, and how they can be decoupled.
Architecture of the FusionCharts Export Server
The FusionCharts Export Server is made up of the following three modules:
- Converter Module
- Stats Logging Module
- Server Module
All three modules are packaged into a single entity that can then be deployed at the server.
The Converter Module
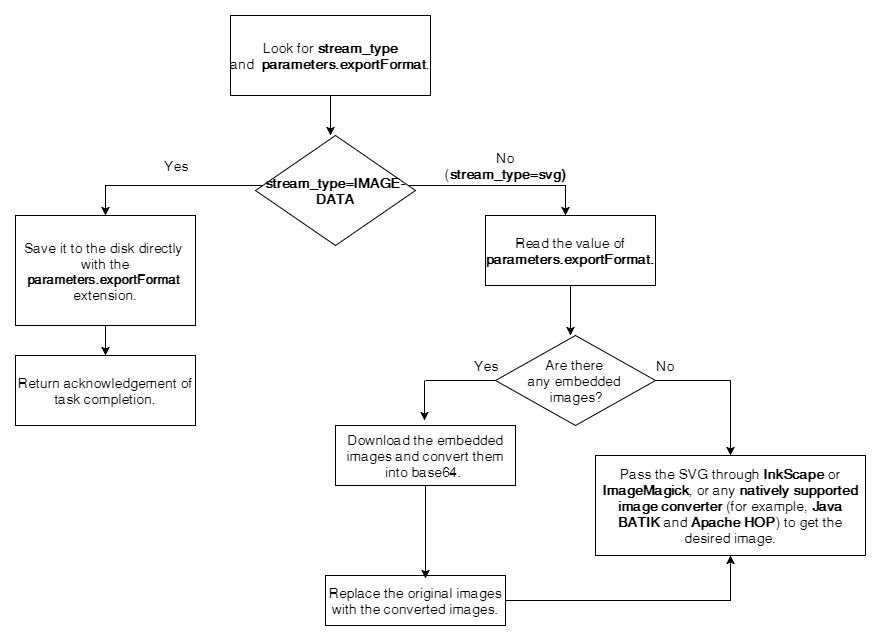
When a chart is to be exported, the converter module takes the chart’s SVG as input and gives the image/PDF/chart data, as selected, as the output.
This module is:
- Independent of the server’s framework and should have the intelligence required to understand how the incoming data is to be processed
- Independent of the server’s request and response object
- Consumed by the server module
The Stats Logging Module
The stats logging module has logging capabilities embedded in it.
The Server Module
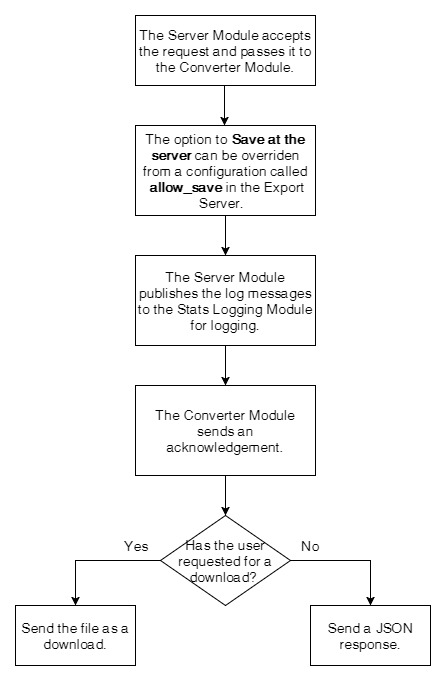
The server module uses the converter module to act as a complete export server. After the server module gets an acknowledgement of the conversion request being processed from the converter module, it communicates with the queuing system to asynchronously log information using the stats logging module.
The server module:
- Can be used to run and deploy the private export server
- Has the power to override the saving feature at the server-side
Workflow of the Modules
Workflow of the Converter Module

Workflow of the Server Module

Decoupling of the Converter Module and the Logging Module
In the overall architecture of the FusionCharts Export Server, the converter module and the stats logging module have been coupled in a way that decoupling them is easy.
The two modules have been designed in a way that they can work independently of each other. Consequently, the exporting and logging features can also work independent of each other.
This is an important design consideration because the export converter is not necessary for most modern browsers and hence can be avoided in some scenarios.
ImageMagick and Inkscape are also hard dependencies for the converter module. Given that both of them are executables, they can be considered as a security risk. As the logging module can be easily decoupled from the converter module, one can easily get rid of the converter module.

