
Toolbar
FusionCharts Suite XT introduces the toolbar starting version 3.11.0. The advantage of having a toolbar is that it manages all the UI action elements (context menus, checkboxes, buttons) centrally, providing a uniform and clean look and a better meaningful and logical grouping.
Introducing the toolbar has resulted in changes in the way certain chart elements are implemented. The table below summarizes the changes in implementation:
| Chart Type | Component | Previous Implementation | Current Implementation |
|---|---|---|---|
Multi-axis line chart |
Checkboxes to show/hide axes lines |
HTML checkboxes |
Pure SVG exportable checkboxes |
Drag-able column, line, and area charts |
Menu to change y-axis limits |
Menu placed at the bottom-left side of the chart |
Context menu |
Drag-node chart |
Menu to add/edit/delete nodes, labels, and connectors |
Menu placed at the bottom-left side of the chart |
Context menu |
Real-time charts |
Message logger |
Menu placed at the bottom-left side of the chart |
Context menu |
Real-time charts |
Real-time menu |
Menu placed at the bottom-left side of the chart |
Context menu |
The samples shown below showcase the difference between the current and the previous implementations of the toolbar.
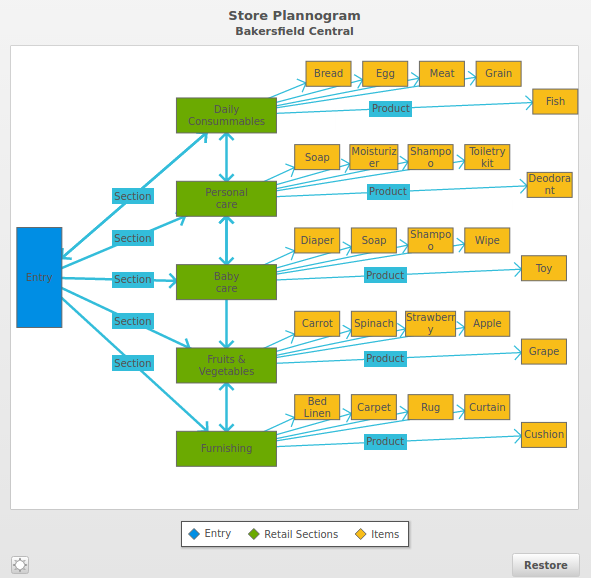
The drag-node chart below shows the current implementation of the toolbar:
{
"chart": {
"caption": "Store Plannogram",
"subcaption": "Bakersfield Central",
"showcanvasborder": "1",
"canvasborderAlpha": "50",
"canvasborderthickness": "0.4",
"showlegend": "1",
"viewmode": "0",
"showXAxisLine": "0",
"xaxismaxvalue": "100",
"yaxismaxvalue": "100",
"theme": "fint"
},
"dataset": [
{
"seriesname": "Entry",
"color": "#008ee4",
"data": [
{
"x": "5",
"y": "50",
"width": "45",
"height": "100",
"name": "Entry",
"id": "1",
"allowdrag": "1",
"shape": "rectangle"
}
]
},
{
"seriesname": "Retail Sections",
"color": "#6baa01",
"data": [
{
"x": "38",
"y": "85",
"width": "100",
"height": "35",
"name": "Daily{br}Consummables",
"id": "2",
"allowdrag": "1",
"shape": "rectangle"
},
{
"x": "38",
"y": "67",
"width": "100",
"height": "35",
"name": "Personal{br}care",
"id": "3",
"allowdrag": "1",
"shape": "rectangle"
},
{
"x": "38",
"y": "49",
"width": "100",
"height": "35",
"name": "Baby{br}care",
"id": "4",
"allowdrag": "1",
"shape": "rectangle"
},
{
"x": "38",
"y": "31",
"width": "100",
"height": "35",
"name": "Fruits &{br}Vegetables",
"id": "5",
"allowdrag": "1",
"shape": "rectangle"
},
{
"x": "38",
"y": "13",
"width": "100",
"height": "35",
"name": "Furnishing",
"id": "6",
"allowdrag": "1",
"shape": "rectangle"
}
]
},
{
"seriesname": "Items",
"color": "#f8bd19",
"data": [
{
"x": "56",
"y": "94",
"name": "Bread",
"width": "45",
"height": "25",
"id": "7",
"allowdrag": "1",
"shape": "Rectangle"
},
{
"x": "66",
"y": "94",
"name": "Egg",
"width": "45",
"height": "25",
"id": "8",
"allowdrag": "1",
"shape": "Rectangle"
},
{
"x": "76",
"y": "94",
"name": "Meat",
"width": "45",
"height": "25",
"id": "9",
"allowdrag": "1",
"shape": "Rectangle"
},
{
"x": "86",
"y": "94",
"name": "Grain",
"id": "10",
"allowdrag": "1",
"width": "45",
"height": "25",
"shape": "Rectangle"
},
{
"x": "96",
"y": "88",
"name": "Fish",
"id": "11",
"allowdrag": "1",
"width": "45",
"height": "25",
"shape": "Rectangle"
},
{
"x": "54",
"y": "76",
"name": "Soap",
"id": "12",
"allowdrag": "1",
"width": "45",
"height": "25",
"shape": "Rectangle"
},
{
"x": "64",
"y": "76",
"name": "Moisturizer",
"id": "13",
"allowdrag": "1",
"width": "48",
"height": "25",
"shape": "Rectangle"
},
{
"x": "74",
"y": "76",
"name": "Shampoo",
"id": "14",
"allowdrag": "1",
"width": "45",
"height": "25",
"shape": "Rectangle"
},
{
"x": "84",
"y": "76",
"name": "Toiletry kit",
"id": "15",
"allowdrag": "1",
"width": "45",
"height": "25",
"shape": "Rectangle"
},
{
"x": "95",
"y": "70",
"name": "Deodorant",
"id": "16",
"allowdrag": "1",
"width": "45",
"height": "25",
"shape": "Rectangle"
},
{
"x": "54",
"y": "58",
"name": "Diaper",
"id": "17",
"allowdrag": "1",
"width": "45",
"height": "25",
"shape": "Rectangle"
},
{
"x": "64",
"y": "58",
"name": "Soap",
"id": "18",
"allowdrag": "1",
"width": "45",
"height": "25",
"shape": "Rectangle"
},
{
"x": "74",
"y": "58",
"name": "Shampoo",
"id": "19",
"allowdrag": "1",
"width": "45",
"height": "25",
"shape": "Rectangle"
},
{
"x": "84",
"y": "58",
"name": "Wipe",
"id": "20",
"allowdrag": "1",
"width": "45",
"height": "25",
"shape": "Rectangle"
},
{
"x": "94",
"y": "52",
"name": "Toy",
"id": "21",
"allowdrag": "1",
"width": "45",
"height": "25",
"shape": "Rectangle"
},
{
"x": "54",
"y": "40",
"name": "Carrot",
"id": "22",
"allowdrag": "1",
"width": "45",
"height": "25",
"shape": "Rectangle"
},
{
"x": "64",
"y": "40",
"name": "Spinach",
"id": "23",
"allowdrag": "1",
"width": "45",
"height": "25",
"shape": "Rectangle"
},
{
"x": "74",
"y": "40",
"name": "Strawberry",
"id": "24",
"allowdrag": "1",
"width": "50",
"height": "25",
"shape": "Rectangle"
},
{
"x": "84",
"y": "40",
"name": "Apple",
"id": "25",
"allowdrag": "1",
"width": "45",
"height": "25",
"shape": "Rectangle"
},
{
"x": "94",
"y": "34",
"name": "Grape",
"id": "26",
"allowdrag": "1",
"width": "45",
"height": "25",
"shape": "Rectangle"
},
{
"x": "54",
"y": "22",
"name": "Bed Linen",
"id": "27",
"allowdrag": "1",
"width": "45",
"height": "25",
"shape": "Rectangle"
},
{
"x": "64",
"y": "22",
"name": "Carpet",
"id": "28",
"allowdrag": "1",
"width": "45",
"height": "25",
"shape": "Rectangle"
},
{
"x": "74",
"y": "22",
"name": "Rug",
"id": "29",
"allowdrag": "1",
"width": "45",
"height": "25",
"shape": "Rectangle"
},
{
"x": "84",
"y": "22",
"name": "Curtain",
"id": "30",
"allowdrag": "1",
"width": "45",
"height": "25",
"shape": "Rectangle"
},
{
"x": "94",
"y": "16",
"name": "Cushion",
"id": "31",
"allowdrag": "1",
"width": "45",
"height": "25",
"shape": "Rectangle"
}
]
}
],
"connectors": [
{
"color": "#33bdda",
"stdthickness": "5",
"connector": [
{
"strength": "0.5",
"label": "Section",
"from": "1",
"to": "2",
"arrowatstart": "0",
"arrowatend": "1"
},
{
"strength": "0.5",
"label": "Section",
"from": "1",
"to": "3",
"arrowatstart": "0",
"arrowatend": "1"
},
{
"strength": "0.5",
"label": "Section",
"from": "1",
"to": "4",
"arrowatstart": "0",
"arrowatend": "1"
},
{
"strength": "0.5",
"label": "Section",
"from": "1",
"to": "5",
"arrowatstart": "0",
"arrowatend": "1"
},
{
"strength": "0.5",
"label": "Section",
"from": "1",
"to": "6",
"arrowatstart": "0",
"arrowatend": "1"
},
{
"strength": "0.5",
"label": "",
"from": "1",
"to": "2",
"arrowatstart": "1",
"arrowatend": "1"
},
{
"strength": "0.5",
"label": "",
"from": "2",
"to": "3",
"arrowatstart": "1",
"arrowatend": "1"
},
{
"strength": "0.5",
"label": "",
"from": "3",
"to": "4",
"arrowatstart": "1",
"arrowatend": "1"
},
{
"strength": "0.5",
"label": "",
"from": "3",
"to": "5",
"arrowatstart": "1",
"arrowatend": "1"
},
{
"strength": "0.5",
"label": "",
"from": "5",
"to": "6",
"arrowatstart": "1",
"arrowatend": "1"
},
{
"strength": "0.25",
"label": "",
"from": "2",
"to": "7",
"arrowatstart": "0",
"arrowatend": "1"
},
{
"strength": "0.25",
"label": "",
"from": "2",
"to": "8",
"arrowatstart": "0",
"arrowatend": "1"
},
{
"strength": "0.25",
"label": "",
"from": "2",
"to": "9",
"arrowatstart": "0",
"arrowatend": "1"
},
{
"strength": "0.25",
"label": "",
"from": "2",
"to": "10",
"arrowatstart": "0",
"arrowatend": "1"
},
{
"strength": "0.25",
"label": "Product",
"from": "2",
"to": "11",
"arrowatstart": "0",
"arrowatend": "1"
},
{
"strength": "0.25",
"label": "",
"from": "3",
"to": "12",
"arrowatstart": "0",
"arrowatend": "1"
},
{
"strength": "0.25",
"label": "",
"from": "3",
"to": "13",
"arrowatstart": "0",
"arrowatend": "1"
},
{
"strength": "0.25",
"label": "",
"from": "3",
"to": "14",
"arrowatstart": "0",
"arrowatend": "1"
},
{
"strength": "0.25",
"label": "",
"from": "3",
"to": "15",
"arrowatstart": "0",
"arrowatend": "1"
},
{
"strength": "0.25",
"label": "Product",
"from": "3",
"to": "16",
"arrowatstart": "0",
"arrowatend": "1"
},
{
"strength": "0.25",
"label": "",
"from": "4",
"to": "17",
"arrowatstart": "0",
"arrowatend": "1"
},
{
"strength": "0.25",
"label": "",
"from": "4",
"to": "18",
"arrowatstart": "0",
"arrowatend": "1"
},
{
"strength": "0.25",
"label": "",
"from": "4",
"to": "19",
"arrowatstart": "0",
"arrowatend": "1"
},
{
"strength": "0.25",
"label": "",
"from": "4",
"to": "20",
"arrowatstart": "0",
"arrowatend": "1"
},
{
"strength": "0.25",
"label": "Product",
"from": "4",
"to": "21",
"arrowatstart": "0",
"arrowatend": "1"
},
{
"strength": "0.25",
"label": "",
"from": "5",
"to": "22",
"arrowatstart": "0",
"arrowatend": "1"
},
{
"strength": "0.25",
"label": "",
"from": "5",
"to": "23",
"arrowatstart": "0",
"arrowatend": "1"
},
{
"strength": "0.25",
"label": "",
"from": "5",
"to": "24",
"arrowatstart": "0",
"arrowatend": "1"
},
{
"strength": "0.25",
"label": "",
"from": "5",
"to": "25",
"arrowatstart": "0",
"arrowatend": "1"
},
{
"strength": "0.25",
"label": "Product",
"from": "5",
"to": "26",
"arrowatstart": "0",
"arrowatend": "1"
},
{
"strength": "0.25",
"label": "",
"from": "6",
"to": "27",
"arrowatstart": "0",
"arrowatend": "1"
},
{
"strength": "0.25",
"label": "",
"from": "6",
"to": "28",
"arrowatstart": "0",
"arrowatend": "1"
},
{
"strength": "0.25",
"label": "",
"from": "6",
"to": "29",
"arrowatstart": "0",
"arrowatend": "1"
},
{
"strength": "0.25",
"label": "",
"from": "6",
"to": "30",
"arrowatstart": "0",
"arrowatend": "1"
},
{
"strength": "0.25",
"label": "Product",
"from": "6",
"to": "31",
"arrowatstart": "0",
"arrowatend": "1"
}
]
}
]
}<html>
<head>
<title>My first chart using FusionCharts Suite XT</title>
<script type="text/javascript" src="http://static.fusioncharts.com/code/latest/fusioncharts.js"></script>
<script type="text/javascript" src="http://static.fusioncharts.com/code/latest/themes/fusioncharts.theme.fint.js?cacheBust=56"></script>
<script type="text/javascript">
FusionCharts.ready(function(){
var fusioncharts = new FusionCharts( {
type: 'dragnode',
renderAt: 'chart-container',
width: '600',
height: '600',
dataFormat: 'json',
dataSource: {
"chart": {
"caption": "Store Plannogram",
"subcaption": "Bakersfield Central",
"showcanvasborder": "1",
"canvasborderAlpha": "50",
"canvasborderthickness": "0.4",
"showlegend": "1",
"viewmode": "0",
"showXAxisLine" : "0",
"xaxismaxvalue": "100",
"yaxismaxvalue": "100",
//Theme
"theme" : "fint"
},
"dataset": [
{
"seriesname": "Entry",
"color": "#008ee4",
"data": [
{
"x": "5",
"y": "50",
"width": "45",
"height": "100",
"name": "Entry",
"id": "1",
"allowdrag": "1",
"shape": "rectangle"
}
]
},
{
"seriesname": "Retail Sections",
"color": "#6baa01",
"data": [
{
"x": "38",
"y": "85",
"width": "100",
"height": "35",
"name": "Daily{br}Consummables",
"id": "2",
"allowdrag": "1",
"shape": "rectangle"
},
{
"x": "38",
"y": "67",
"width": "100",
"height": "35",
"name": "Personal{br}care",
"id": "3",
"allowdrag": "1",
"shape": "rectangle"
},
{
"x": "38",
"y": "49",
"width": "100",
"height": "35",
"name": "Baby{br}care",
"id": "4",
"allowdrag": "1",
"shape": "rectangle"
},
{
"x": "38",
"y": "31",
"width": "100",
"height": "35",
"name": "Fruits &{br}Vegetables",
"id": "5",
"allowdrag": "1",
"shape": "rectangle"
},
{
"x": "38",
"y": "13",
"width": "100",
"height": "35",
"name": "Furnishing",
"id": "6",
"allowdrag": "1",
"shape": "rectangle"
}
]
},
{
"seriesname": "Items",
"color": "#f8bd19",
"data": [
{
"x": "56",
"y": "94",
"name": "Bread",
"width": "45",
"height": "25",
"id": "7",
"allowdrag": "1",
"shape": "Rectangle",
//"radius": "25"
},
{
"x": "66",
"y": "94",
"name": "Egg",
"width": "45",
"height": "25",
"id": "8",
"allowdrag": "1",
"shape": "Rectangle"
},
{
"x": "76",
"y": "94",
"name": "Meat",
"width": "45",
"height": "25",
"id": "9",
"allowdrag": "1",
"shape": "Rectangle"
},
{
"x": "86",
"y": "94",
"name": "Grain",
"id": "10",
"allowdrag": "1",
"width": "45",
"height": "25",
"shape": "Rectangle"
},
{
"x": "96",
"y": "88",
"name": "Fish",
"id": "11",
"allowdrag": "1",
"width": "45",
"height": "25",
"shape": "Rectangle"
},
{
"x": "54",
"y": "76",
"name": "Soap",
"id": "12",
"allowdrag": "1",
"width": "45",
"height": "25",
"shape": "Rectangle"
},
{
"x": "64",
"y": "76",
"name": "Moisturizer",
"id": "13",
"allowdrag": "1",
"width": "48",
"height": "25",
"shape": "Rectangle"
},
{
"x": "74",
"y": "76",
"name": "Shampoo",
"id": "14",
"allowdrag": "1",
"width": "45",
"height": "25",
"shape": "Rectangle"
},
{
"x": "84",
"y": "76",
"name": "Toiletry kit",
"id": "15",
"allowdrag": "1",
"width": "45",
"height": "25",
"shape": "Rectangle"
},
{
"x": "95",
"y": "70",
"name": "Deodorant",
"id": "16",
"allowdrag": "1",
"width": "45",
"height": "25",
"shape": "Rectangle"
},
{
"x": "54",
"y": "58",
"name": "Diaper",
"id": "17",
"allowdrag": "1",
"width": "45",
"height": "25",
"shape": "Rectangle"
},
{
"x": "64",
"y": "58",
"name": "Soap",
"id": "18",
"allowdrag": "1",
"width": "45",
"height": "25",
"shape": "Rectangle"
},
{
"x": "74",
"y": "58",
"name": "Shampoo",
"id": "19",
"allowdrag": "1",
"width": "45",
"height": "25",
"shape": "Rectangle"
},
{
"x": "84",
"y": "58",
"name": "Wipe",
"id": "20",
"allowdrag": "1",
"width": "45",
"height": "25",
"shape": "Rectangle"
},
{
"x": "94",
"y": "52",
"name": "Toy",
"id": "21",
"allowdrag": "1",
"width": "45",
"height": "25",
"shape": "Rectangle"
},
{
"x": "54",
"y": "40",
"name": "Carrot",
"id": "22",
"allowdrag": "1",
"width": "45",
"height": "25",
"shape": "Rectangle"
},
{
"x": "64",
"y": "40",
"name": "Spinach",
"id": "23",
"allowdrag": "1",
"width": "45",
"height": "25",
"shape": "Rectangle"
},
{
"x": "74",
"y": "40",
"name": "Strawberry",
"id": "24",
"allowdrag": "1",
"width": "50",
"height": "25",
"shape": "Rectangle"
},
{
"x": "84",
"y": "40",
"name": "Apple",
"id": "25",
"allowdrag": "1",
"width": "45",
"height": "25",
"shape": "Rectangle"
},
{
"x": "94",
"y": "34",
"name": "Grape",
"id": "26",
"allowdrag": "1",
"width": "45",
"height": "25",
"shape": "Rectangle"
},
{
"x": "54",
"y": "22",
"name": "Bed Linen",
"id": "27",
"allowdrag": "1",
"width": "45",
"height": "25",
"shape": "Rectangle"
},
{
"x": "64",
"y": "22",
"name": "Carpet",
"id": "28",
"allowdrag": "1",
"width": "45",
"height": "25",
"shape": "Rectangle"
},
{
"x": "74",
"y": "22",
"name": "Rug",
"id": "29",
"allowdrag": "1",
"width": "45",
"height": "25",
"shape": "Rectangle"
},
{
"x": "84",
"y": "22",
"name": "Curtain",
"id": "30",
"allowdrag": "1",
"width": "45",
"height": "25",
"shape": "Rectangle"
},
{
"x": "94",
"y": "16",
"name": "Cushion",
"id": "31",
"allowdrag": "1",
"width": "45",
"height": "25",
"shape": "Rectangle"
}
]
}
],
"connectors": [
{
"color": "#33bdda",
"stdthickness": "5",
"connector": [
{
"strength": "0.5",
"label": "Section",
"from": "1",
"to": "2",
"arrowatstart": "0",
"arrowatend": "1"
},
{
"strength": "0.5",
"label": "Section",
"from": "1",
"to": "3",
"arrowatstart": "0",
"arrowatend": "1"
},
{
"strength": "0.5",
"label": "Section",
"from": "1",
"to": "4",
"arrowatstart": "0",
"arrowatend": "1"
},
{
"strength": "0.5",
"label": "Section",
"from": "1",
"to": "5",
"arrowatstart": "0",
"arrowatend": "1"
},
{
"strength": "0.5",
"label": "Section",
"from": "1",
"to": "6",
"arrowatstart": "0",
"arrowatend": "1"
},
{
"strength": "0.5",
"label": "",
"from": "1",
"to": "2",
"arrowatstart": "1",
"arrowatend": "1"
},
{
"strength": "0.5",
"label": "",
"from": "2",
"to": "3",
"arrowatstart": "1",
"arrowatend": "1"
},
{
"strength": "0.5",
"label": "",
"from": "3",
"to": "4",
"arrowatstart": "1",
"arrowatend": "1"
},
{
"strength": "0.5",
"label": "",
"from": "3",
"to": "5",
"arrowatstart": "1",
"arrowatend": "1"
},
{
"strength": "0.5",
"label": "",
"from": "5",
"to": "6",
"arrowatstart": "1",
"arrowatend": "1"
},
{
"strength": "0.25",
"label": "",
"from": "2",
"to": "7",
"arrowatstart": "0",
"arrowatend": "1"
},
{
"strength": "0.25",
"label": "",
"from": "2",
"to": "8",
"arrowatstart": "0",
"arrowatend": "1"
},
{
"strength": "0.25",
"label": "",
"from": "2",
"to": "9",
"arrowatstart": "0",
"arrowatend": "1"
},
{
"strength": "0.25",
"label": "",
"from": "2",
"to": "10",
"arrowatstart": "0",
"arrowatend": "1"
},
{
"strength": "0.25",
"label": "Product",
"from": "2",
"to": "11",
"arrowatstart": "0",
"arrowatend": "1"
},
{
"strength": "0.25",
"label": "",
"from": "3",
"to": "12",
"arrowatstart": "0",
"arrowatend": "1"
},
{
"strength": "0.25",
"label": "",
"from": "3",
"to": "13",
"arrowatstart": "0",
"arrowatend": "1"
},
{
"strength": "0.25",
"label": "",
"from": "3",
"to": "14",
"arrowatstart": "0",
"arrowatend": "1"
},
{
"strength": "0.25",
"label": "",
"from": "3",
"to": "15",
"arrowatstart": "0",
"arrowatend": "1"
},
{
"strength": "0.25",
"label": "Product",
"from": "3",
"to": "16",
"arrowatstart": "0",
"arrowatend": "1"
},
{
"strength": "0.25",
"label": "",
"from": "4",
"to": "17",
"arrowatstart": "0",
"arrowatend": "1"
},
{
"strength": "0.25",
"label": "",
"from": "4",
"to": "18",
"arrowatstart": "0",
"arrowatend": "1"
},
{
"strength": "0.25",
"label": "",
"from": "4",
"to": "19",
"arrowatstart": "0",
"arrowatend": "1"
},
{
"strength": "0.25",
"label": "",
"from": "4",
"to": "20",
"arrowatstart": "0",
"arrowatend": "1"
},
{
"strength": "0.25",
"label": "Product",
"from": "4",
"to": "21",
"arrowatstart": "0",
"arrowatend": "1"
},
{
"strength": "0.25",
"label": "",
"from": "5",
"to": "22",
"arrowatstart": "0",
"arrowatend": "1"
},
{
"strength": "0.25",
"label": "",
"from": "5",
"to": "23",
"arrowatstart": "0",
"arrowatend": "1"
},
{
"strength": "0.25",
"label": "",
"from": "5",
"to": "24",
"arrowatstart": "0",
"arrowatend": "1"
},
{
"strength": "0.25",
"label": "",
"from": "5",
"to": "25",
"arrowatstart": "0",
"arrowatend": "1"
},
{
"strength": "0.25",
"label": "Product",
"from": "5",
"to": "26",
"arrowatstart": "0",
"arrowatend": "1"
},
{
"strength": "0.25",
"label": "",
"from": "6",
"to": "27",
"arrowatstart": "0",
"arrowatend": "1"
},
{
"strength": "0.25",
"label": "",
"from": "6",
"to": "28",
"arrowatstart": "0",
"arrowatend": "1"
},
{
"strength": "0.25",
"label": "",
"from": "6",
"to": "29",
"arrowatstart": "0",
"arrowatend": "1"
},
{
"strength": "0.25",
"label": "",
"from": "6",
"to": "30",
"arrowatstart": "0",
"arrowatend": "1"
},
{
"strength": "0.25",
"label": "Product",
"from": "6",
"to": "31",
"arrowatstart": "0",
"arrowatend": "1"
}
]
}
]
}
});
fusioncharts.render();
});
</script>
</head>
<body>
<div id="chart-container">FusionCharts XT will load here!</div>
</body>
</html>The image below shows the previous implementation:
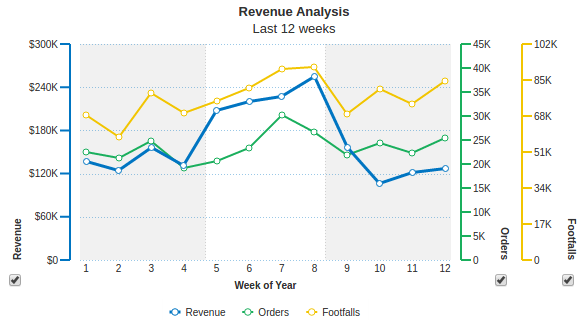
The multi-axis line chart below shows the current implementation of the checkboxes used to show/hide the axes lines. This implementation uses pure SVG exportable checkboxes; the previous implementation used HTML checkboxes.
{
    "chart": {
        "caption": "Revenue Analysis",
        "subcaption": "Last 12 weeks",
        "baseFontColor": "#333333",
        "baseFont": "Helvetica Neue,Arial",
        "xaxisname": "Week of Year",
        "showvalues": "0",
        "numvdivlines": "2",
        "paletteColors": "#0075c2,#1aaf5d,#f2c500,#f45b00",
        "bgColor": "#ffffff",
        "canvasBgColor": "#ffffff",
        "captionFontSize": "13",
        "subcaptionFontSize": "13",
        "subcaptionFontBold": "0",
        "showBorder": "0",
        "showPlotBorder": "0",
        "showXAxisLine": "1",
        "showShadow": "0",
        "showCanvasBorder": "0",
        "showAlternateHGridColor": "0",
        "showalternatevgridcolor": "1",
        "usePlotGradientColor": "0",
        "divlineColor": "#999999",
        "divlineThickness": "1",
        "divLineIsDashed": "1",
        "divLineDashLen": "1",
        "divLineGapLen": "1",
        "xAxisLineThickness": "1",
        "xAxisLineColor": "#999999",
        "legendBorderAlpha": "0",
        "legendShadow": "0",
        "alignCaptionWithCanvas": "0",
        "checkBoxColor": "#3333cc"
    },
    "categories": [
        {
            "category": [
                {
                    "label": "1"
                },
                {
                    "label": "2"
                },
                {
                    "label": "3"
                },
                {
                    "label": "4"
                },
                {
                    "label": "5"
                },
                {
                    "label": "6"
                },
                {
                    "label": "7"
                },
                {
                    "label": "8"
                },
                {
                    "label": "9"
                },
                {
                    "label": "10"
                },
                {
                    "label": "11"
                },
                {
                    "label": "12"
                }
            ]
        }
    ],
    "axis": [
        {
            "title": "Revenue",
            "titlepos": "left",
            "tickwidth": "10",
            "numberPrefix": "$",
            "divlineisdashed": "1",
            "dataset": [
                {
                    "seriesname": "Revenue",
                    "lineThickness": "3",
                    "data": [
                        {
                            "value": "137500"
                        },
                        {
                            "value": "124350"
                        },
                        {
                            "value": "156700"
                        },
                        {
                            "value": "131450"
                        },
                        {
                            "value": "208300"
                        },
                        {
                            "value": "219900"
                        },
                        {
                            "value": "227500"
                        },
                        {
                            "value": "254300"
                        },
                        {
                            "value": "155900"
                        },
                        {
                            "value": "105650"
                        },
                        {
                            "value": "120950"
                        },
                        {
                            "value": "127500"
                        }
                    ]
                }
            ]
        },
        {
            "title": "Orders",
            "axisOnLeft": "0",
            "titlePos": "right",
            "numDivlines": "8",
            "tickWidth": "10",
            "divlineIsDashed": "1",
            "dataset": [
                {
                    "seriesname": "Orders",
                    "data": [
                        {
                            "value": "22567"
                        },
                        {
                            "value": "21348"
                        },
                        {
                            "value": "24846"
                        },
                        {
                            "value": "19237"
                        },
                        {
                            "value": "20672"
                        },
                        {
                            "value": "23403"
                        },
                        {
                            "value": "30278"
                        },
                        {
                            "value": "26719"
                        },
                        {
                            "value": "21940"
                        },
                        {
                            "value": "24396"
                        },
                        {
                            "value": "22340"
                        },
                        {
                            "value": "25439"
                        }
                    ]
                }
            ]
        },
        {
            "title": "Footfalls",
            "titlePos": "right",
            "axisOnLeft": "0",
            "numDivlines": "5",
            "tickWidth": "10",
            "numberSuffix": "",
            "divlineIsDashed": "1",
            "dataset": [
                {
                    "seriesname": "Footfalls",
                    "data": [
                        {
                            "value": "68473"
                        },
                        {
                            "value": "57934"
                        },
                        {
                            "value": "78925"
                        },
                        {
                            "value": "69213"
                        },
                        {
                            "value": "74892"
                        },
                        {
                            "value": "81123"
                        },
                        {
                            "value": "90086"
                        },
                        {
                            "value": "91174"
                        },
                        {
                            "value": "68934"
                        },
                        {
                            "value": "80934"
                        },
                        {
                            "value": "73634"
                        },
                        {
                            "value": "84453"
                        }
                    ]
                }
            ]
        }
    ]
}
<html>
<head>
<title>My first chart using FusionCharts Suite XT</title>
<script type="text/javascript" src="http://static.fusioncharts.com/code/latest/fusioncharts.js"></script>
<script type="text/javascript" src="http://static.fusioncharts.com/code/latest/themes/fusioncharts.theme.fint.js?cacheBust=56"></script>
<script type="text/javascript">
FusionCharts.ready(function(){
var fusioncharts = new FusionCharts({
type: 'multiaxisline',
renderAt: 'chart-container',
width: '600',
height: '350',
dataFormat: 'json',
dataSource: {
"chart": {
"caption": "Revenue Analysis",
"subcaption": "Last 12 weeks",
"baseFontColor" : "#333333",
"baseFont" : "Helvetica Neue,Arial",
"xaxisname": "Week of Year",
"showvalues": "0",
"numvdivlines": "2",
"paletteColors" : "#0075c2,#1aaf5d,#f2c500,#f45b00",
"bgColor" : "#ffffff",
"canvasBgColor" : "#ffffff",
"captionFontSize" : "13",
"subcaptionFontSize" : "13",
"subcaptionFontBold" : "0",
"showBorder" : "0",
"showPlotBorder": "0",
"showXAxisLine" : "1",
"showShadow" : "0",
"showCanvasBorder" : "0",
"showAlternateHGridColor" : "0",
"showalternatevgridcolor": "1",
"usePlotGradientColor" :"0",
"divlineColor" : "#999999",
"divlineThickness" : "1",
"divLineIsDashed" : "1",
"divLineDashLen" : "1",
"divLineGapLen" : "1",
"xAxisLineThickness" : "1",
"xAxisLineColor" : "#999999",
"legendBorderAlpha": "0",
"legendShadow": "0",
"alignCaptionWithCanvas": "0",
"checkBoxColor": "#3333cc"
},
"categories": [{
"category": [{
"label": "1"
}, {
"label": "2"
}, {
"label": "3"
}, {
"label": "4"
}, {
"label": "5"
}, {
"label": "6"
}, {
"label": "7"
}, {
"label": "8"
}, {
"label": "9"
}, {
"label": "10"
}, {
"label": "11"
}, {
"label": "12"
}]
}],
"axis": [{
"title": "Revenue",
"titlepos": "left",
"tickwidth": "10",
"numberPrefix": "$",
"divlineisdashed": "1",
"dataset": [{
"seriesname": "Revenue",
"lineThickness": "3",
"data": [{
"value": "137500"
}, {
"value": "124350"
}, {
"value": "156700"
}, {
"value": "131450"
}, {
"value": "208300"
}, {
"value": "219900"
}, {
"value": "227500"
}, {
"value": "254300"
}, {
"value": "155900"
}, {
"value": "105650"
}, {
"value": "120950"
}, {
"value": "127500"
}]
}]
}, {
"title": "Orders",
"axisOnLeft": "0",
"titlePos": "right",
"numDivlines": "8",
"tickWidth": "10",
"divlineIsDashed": "1",
"dataset": [{
"seriesname": "Orders",
"data": [{
"value": "22567"
}, {
"value": "21348"
}, {
"value": "24846"
}, {
"value": "19237"
}, {
"value": "20672"
}, {
"value": "23403"
}, {
"value": "30278"
}, {
"value": "26719"
}, {
"value": "21940"
}, {
"value": "24396"
}, {
"value": "22340"
}, {
"value": "25439"
}]
}]
}, {
"title": "Footfalls",
"titlePos": "right",
"axisOnLeft": "0",
"numDivlines": "5",
"tickWidth": "10",
"numberSuffix": "",
"divlineIsDashed": "1",
"dataset": [{
"seriesname": "Footfalls",
"data": [{
"value": "68473"
}, {
"value": "57934"
}, {
"value": "78925"
}, {
"value": "69213"
}, {
"value": "74892"
}, {
"value": "81123"
}, {
"value": "90086"
}, {
"value": "91174"
}, {
"value": "68934"
}, {
"value": "80934"
}, {
"value": "73634"
}, {
"value": "84453"
}]
}]
}]
}
}
);
fusioncharts.render();
});
</script>
</head>
<body>
<div id="chart-container">FusionCharts XT will load here!</div>
</body>
</html>The image below shows the previous implementation:
The difference between the current and previous implementation of the checkboxes, in the multi-axis line chart, is that the present checkboxes can be configured to set a custom checkbox color.
Given below is a brief description of the attribute used for this customization:
| Attribute Name | Decription |
|---|---|
checkBoxColor |
Set the hex color code for the checkbox border and the checkmark |