Cross Line
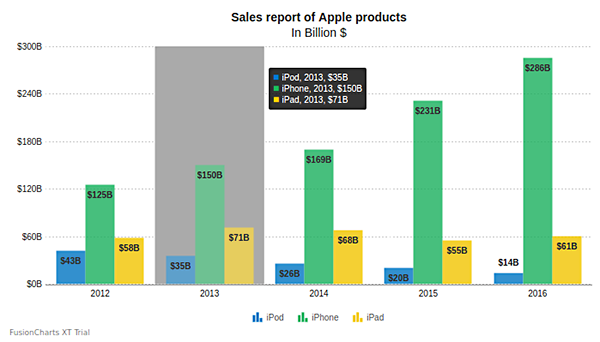
Cross line is a vertical line/area used as quick reference for the data plots. So what it does, is, when you hover on the canvas a line/area appears highlighting the data plots along with the information in a tooltip. The tooltip that appears is consolidated with all the information required, for example, data values, labels of each data plot and also the color of the data plots. A cross line appears as shown in the image below:

In this section learn how to:
Customize the Cross line
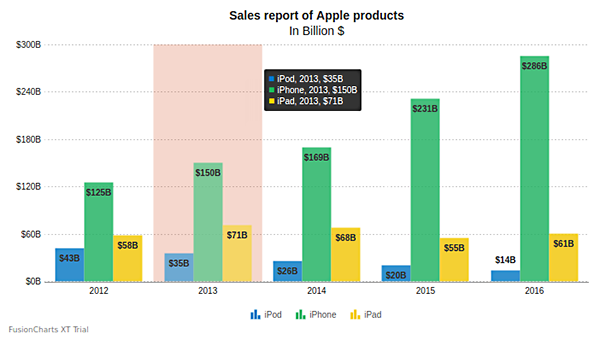
In multi-series charts, when you hover on the chart canvas a color band appears highlighting the corresponding data plots for that particular section of the canvas. This color band is the crossline of the chart. You can customize the color, opacity and animation of the cross line.
Customizing the Color
You can customize the color of the trend band using crossLineColor attribute. A multi series column chart with a customized band color looks as shown below:
{
    "chart": {
        "caption": "Sales report of Apple products",
        "subcaption": "In Billion $",
        "yaxismaxvalue": "250",
        "decimals": "0",
        "numberprefix": "$",
        "numbersuffix": "B",
        "placevaluesinside": "1",
        "valuefontbold": "1",
        "rotatevalues": "0",
        "divlinealpha": "50",
        "plotfillalpha": "80",
        "drawCrossLine": "1",
        "crossLineColor": "#cc3300",
        "crossLineAlpha": "100",
        "theme": "zune"
    },
    "categories": [
        {
            "category": [
                {
                    "label": "2012"
                },
                {
                    "label": "2013"
                },
                {
                    "label": "2014"
                },
                {
                    "label": "2015"
                },
                {
                    "label": "2016"
                }
            ]
        }
    ],
    "dataset": [
        {
            "seriesname": "iPod",
            "data": [
                {
                    "value": "42.63"
                },
                {
                    "value": "35.16"
                },
                {
                    "value": "26.38"
                },
                {
                    "value": "20.38"
                },
                {
                    "value": "14.23"
                }
            ]
        },
        {
            "seriesname": "iPhone",
            "data": [
                {
                    "value": "125.04"
                },
                {
                    "value": "150.26"
                },
                {
                    "value": "169.22"
                },
                {
                    "value": "231.22"
                },
                {
                    "value": "285.67"
                }
            ]
        },
        {
            "seriesname": "iPad",
            "data": [
                {
                    "value": "58.31"
                },
                {
                    "value": "71.04"
                },
                {
                    "value": "67.99"
                },
                {
                    "value": "54.85"
                },
                {
                    "value": "60.53"
                }
            ]
        }
    ]
}
<html>
<head>
<title>My first chart using FusionCharts Suite XT</title>
<script type="text/javascript" src="http://static.fusioncharts.com/code/latest/fusioncharts.js"></script>
<script type="text/javascript" src="http://static.fusioncharts.com/code/latest/themes/fusioncharts.theme.fint.js?cacheBust=56"></script>
<script type="text/javascript">
FusionCharts.ready(function(){
var fusioncharts = new FusionCharts({
type: 'MSColumn2D',
renderAt: 'chart-container',
width: '600',
height: '400',
dataFormat: 'json',
dataSource: {
"chart": {
"caption": "Sales report of Apple products",
"subcaption": "In Billion $",
"yaxismaxvalue": "250",
"decimals": "0",
"numberprefix": "$",
"numbersuffix": "B",
"placevaluesinside": "1",
"valuefontbold": "1",
"rotatevalues": "0",
"divlinealpha": "50",
"plotfillalpha": "80",
"drawCrossLine": "1",
"crossLineColor": "#cc3300",
"crossLineAlpha": "100",
"theme": "zune"
},
"categories": [{
"category": [{
"label": "2012"
},
{
"label": "2013"
},
{
"label": "2014"
},
{
"label": "2015"
},
{
"label": "2016"
}
]
}],
"dataset": [{
"seriesname": "iPod",
"data": [{
"value": "42.63"
},
{
"value": "35.16"
},
{
"value": "26.38"
},
{
"value": "20.38"
},
{
"value": "14.23"
}
]
},
{
"seriesname": "iPhone",
"data": [{
"value": "125.04"
},
{
"value": "150.26"
},
{
"value": "169.22"
},
{
"value": "231.22"
},
{
"value": "285.67"
}
]
},
{
"seriesname": "iPad",
"data": [{
"value": "58.31"
},
{
"value": "71.04"
},
{
"value": "67.99"
},
{
"value": "54.85"
},
{
"value": "60.53"
}
]
}
]
}
});
fusioncharts.render();
});
</script>
</head>
<body>
<div id="chart-container">FusionCharts XT will load here!</div>
</body>
</html>Given below is the attribute used to customize the color of the cross line:
| Attribute | Description |
|---|---|
|
It specifies the color of the cross line. Default Color Value is |
Customizing the Opacity
You can customize the opacity of the cross line using crossLineAlpha attribute. A multi-series column chart with a customized transparency (set to 20) of the cross line looks as shown below:

Given below is the attribute used to customize the opacity of the cross line:
| Attribute | Description |
|---|---|
|
Sets the transparency of cross line. Can take values from |
Enabling/Disabling Animation
FusionCharts allows you to control the animation for the cross line of the chart.You can enable or disable it as per your requirement.
If the animation is enabled, you can also set the animation duration for the cross line of your chart. A multi-series area chart with animation looks as below:
{
    "chart": {
        "caption": "Car sales in UK",
        "subcaption": "April 2015 to March 2016",
        "showvalues": "0",
        "captionpadding": "20",
        "numberPrefix": "$",
        "formatnumberscale": "1",
        "showanchors": "0",
        "labeldisplay": "ROTATE",
        "yaxisvaluespadding": "10",
        "yaxismaxvalue": "60000",
        "slantlabels": "1",
        "animation": "1",
        "paletteColors": "#b2d9f9,#f7c018,#94bf13,#ff9049,#069191",
        "divlinedashlen": "2",
        "divlinedashgap": "4",
        "divlineAlpha": "60",
        "drawCrossLine": "1",
        "crossLineColor": "#0d0d0d",
        "crossLineAlpha": "100",
        "crossLineAnimation": "1",
        "theme": "zune"
    },
    "categories": [
        {
            "category": [
                {
                    "label": "Apr'15"
                },
                {
                    "label": "May'15"
                },
                {
                    "label": "Jun'15"
                },
                {
                    "label": "Jul'15"
                },
                {
                    "label": "Aug'15"
                },
                {
                    "label": "Sep'15"
                },
                {
                    "label": "Oct'15"
                },
                {
                    "label": "Nov'15"
                },
                {
                    "label": "Dec'15"
                },
                {
                    "label": "Jan'16"
                },
                {
                    "label": "Feb'16"
                },
                {
                    "label": "Mar'16"
                }
            ]
        }
    ],
    "dataset": [
        {
            "seriesname": "Ford",
            "data": [
                {
                    "value": "25018"
                },
                {
                    "value": "24273"
                },
                {
                    "value": "33055"
                },
                {
                    "value": "24115"
                },
                {
                    "value": "11980"
                },
                {
                    "value": "55083"
                },
                {
                    "value": "22081"
                },
                {
                    "value": "21597"
                },
                {
                    "value": "21597"
                },
                {
                    "value": "22035"
                },
                {
                    "value": "11513"
                },
                {
                    "value": "59352"
                }
            ]
        },
        {
            "seriesname": "Volkswagen",
            "data": [
                {
                    "value": "18690"
                },
                {
                    "value": "17316"
                },
                {
                    "value": "23670"
                },
                {
                    "value": "15503"
                },
                {
                    "value": "7611"
                },
                {
                    "value": "39263"
                },
                {
                    "value": "13970"
                },
                {
                    "value": "12958"
                },
                {
                    "value": "14415"
                },
                {
                    "value": "12055"
                },
                {
                    "value": "6694"
                },
                {
                    "value": "38694"
                }
            ]
        },
        {
            "seriesname": "Audi",
            "data": [
                {
                    "value": "13264"
                },
                {
                    "value": "13802"
                },
                {
                    "value": "14024"
                },
                {
                    "value": "13004"
                },
                {
                    "value": "5850"
                },
                {
                    "value": "28437"
                },
                {
                    "value": "13182"
                },
                {
                    "value": "11083"
                },
                {
                    "value": "9144"
                },
                {
                    "value": "11513"
                },
                {
                    "value": "5384"
                },
                {
                    "value": "30483"
                }
            ]
        },
        {
            "seriesname": "Nissan",
            "data": [
                {
                    "value": "9844"
                },
                {
                    "value": "11561"
                },
                {
                    "value": "15771"
                },
                {
                    "value": "9912"
                },
                {
                    "value": "3159"
                },
                {
                    "value": "28473"
                },
                {
                    "value": "10392"
                },
                {
                    "value": "8803"
                },
                {
                    "value": "9775"
                },
                {
                    "value": "10720"
                },
                {
                    "value": "4634"
                },
                {
                    "value": "28489"
                }
            ]
        },
        {
            "seriesname": "Renault",
            "data": [
                {
                    "value": "4140"
                },
                {
                    "value": "5453"
                },
                {
                    "value": "6654"
                },
                {
                    "value": "5499"
                },
                {
                    "value": "1734"
                },
                {
                    "value": "15148"
                },
                {
                    "value": "4550"
                },
                {
                    "value": "5844"
                },
                {
                    "value": "6003"
                },
                {
                    "value": "4145"
                },
                {
                    "value": "1948"
                },
                {
                    "value": "17866"
                }
            ]
        }
    ]
}
<html>
<head>
<title>My first chart using FusionCharts Suite XT</title>
<script type="text/javascript" src="http://static.fusioncharts.com/code/latest/fusioncharts.js"></script>
<script type="text/javascript" src="http://static.fusioncharts.com/code/latest/themes/fusioncharts.theme.fint.js?cacheBust=56"></script>
<script type="text/javascript">
FusionCharts.ready(function(){
var fusioncharts = new FusionCharts({
type: 'MSarea',
renderAt: 'chart-container',
width: '600',
height: '400',
dataFormat: 'json',
dataSource: {
"chart": {
"caption": "Car sales in UK",
"subcaption": "April 2015 to March 2016",
"showvalues": "0",
"captionpadding": "20",
"numberPrefix": "$",
"formatnumberscale": "1",
"showanchors": "0",
"labeldisplay": "ROTATE",
"yaxisvaluespadding": "10",
"yaxismaxvalue": "60000",
"slantlabels": "1",
"animation": "1",
"paletteColors": "#b2d9f9,#f7c018,#94bf13,#ff9049,#069191",
"divlinedashlen": "2",
"divlinedashgap": "4",
"divlineAlpha": "60",
"drawCrossLine": "1",
"crossLineColor": "#0d0d0d",
"crossLineAlpha": "100",
"crossLineAnimation": "1",
"theme": "zune"
},
"categories": [{
"category": [{
"label": "Apr'15"
}, {
"label": "May'15"
}, {
"label": "Jun'15"
}, {
"label": "Jul'15"
}, {
"label": "Aug'15"
}, {
"label": "Sep'15"
}, {
"label": "Oct'15"
}, {
"label": "Nov'15"
}, {
"label": "Dec'15"
}, {
"label": "Jan'16"
}, {
"label": "Feb'16"
}, {
"label": "Mar'16"
}]
}],
"dataset": [{
"seriesname": "Ford",
"data": [{
"value": "25018"
}, {
"value": "24273"
}, {
"value": "33055"
}, {
"value": "24115"
}, {
"value": "11980"
}, {
"value": "55083"
}, {
"value": "22081"
}, {
"value": "21597"
}, {
"value": "21597"
}, {
"value": "22035"
}, {
"value": "11513"
}, {
"value": "59352"
}]
}, {
"seriesname": "Volkswagen",
"data": [{
"value": "18690"
}, {
"value": "17316"
}, {
"value": "23670"
}, {
"value": "15503"
}, {
"value": "7611"
}, {
"value": "39263"
}, {
"value": "13970"
}, {
"value": "12958"
}, {
"value": "14415"
}, {
"value": "12055"
}, {
"value": "6694"
}, {
"value": "38694"
}]
}, {
"seriesname": "Audi",
"data": [{
"value": "13264"
}, {
"value": "13802"
}, {
"value": "14024"
}, {
"value": "13004"
}, {
"value": "5850"
}, {
"value": "28437"
}, {
"value": "13182"
}, {
"value": "11083"
}, {
"value": "9144"
}, {
"value": "11513"
}, {
"value": "5384"
}, {
"value": "30483"
}]
}, {
"seriesname": "Nissan",
"data": [{
"value": "9844"
}, {
"value": "11561"
}, {
"value": "15771"
}, {
"value": "9912"
}, {
"value": "3159"
}, {
"value": "28473"
}, {
"value": "10392"
}, {
"value": "8803"
}, {
"value": "9775"
}, {
"value": "10720"
}, {
"value": "4634"
}, {
"value": "28489"
}]
}, {
"seriesname": "Renault",
"data": [{
"value": "4140"
}, {
"value": "5453"
}, {
"value": "6654"
}, {
"value": "5499"
}, {
"value": "1734"
}, {
"value": "15148"
}, {
"value": "4550"
}, {
"value": "5844"
}, {
"value": "6003"
}, {
"value": "4145"
}, {
"value": "1948"
}, {
"value": "17866"
}]
}]
}
});
fusioncharts.render();
});
</script>
</head>
<body>
<div id="chart-container">FusionCharts XT will load here!</div>
</body>
</html>Given below are the attributes used to enable/disable animation and set the animation duration for the cross line:
| Attribute | Description |
|---|---|
|
This attribute gives you the option to control animation of the cross line. If you do not want to animate it, set this as |
|
It specifies the animation duration for the cross line of the chart only if |
Configure the Consolidated Tooltip
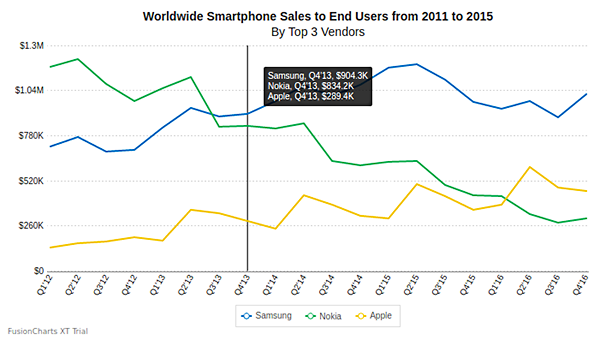
Tooltip is a common element, used to display information when you hover on a particular data point. A consolidated tooltip has been introduced with the cross line which can be used in multi-series charts to get the detailed information of the hovered plots. A multi-series line chart with a consolidated tooltip looks as shown below:
{
    "chart": {
        "caption": "Worldwide Smartphone Sales to End Users from 2011 to 2015",
        "subcaption": "By Top 3 Vendors",
        "linethickness": "2",
        "numberPrefix": "$",
        "showvalues": "0",
        "formatnumberscale": "1",
        "labeldisplay": "ROTATE",
        "slantlabels": "1",
        "divLineAlpha": "40",
        "anchoralpha": "0",
        "animation": "1",
        "legendborderalpha": "20",
        "drawCrossLine": "1",
        "crossLineColor": "#0d0d0d",
        "crossLineAlpha": "100",
        "tooltipGrayOutColor": "#80bfff",
        "theme": "zune"
    },
    "categories": [
        {
            "category": [
                {
                    "label": "Q1'12"
                },
                {
                    "label": "Q2'12"
                },
                {
                    "label": "Q3'12"
                },
                {
                    "label": "Q4'12"
                },
                {
                    "label": "Q1'13"
                },
                {
                    "label": "Q2'13"
                },
                {
                    "label": "Q3'13"
                },
                {
                    "label": "Q4'13"
                },
                {
                    "label": "Q1'14"
                },
                {
                    "label": "Q2'14"
                },
                {
                    "label": "Q3'14"
                },
                {
                    "label": "Q4'14"
                },
                {
                    "label": "Q1'15"
                },
                {
                    "label": "Q2'15"
                },
                {
                    "label": "Q3'15"
                },
                {
                    "label": "Q4'15"
                },
                {
                    "label": "Q1'16"
                },
                {
                    "label": "Q2'16"
                },
                {
                    "label": "Q3'16"
                },
                {
                    "label": "Q4'16"
                }
            ]
        }
    ],
    "dataset": [
        {
            "seriesname": "Samsung",
            "data": [
                {
                    "value": "716000"
                },
                {
                    "value": "771700"
                },
                {
                    "value": "687800"
                },
                {
                    "value": "698300"
                },
                {
                    "value": "826100"
                },
                {
                    "value": "938300"
                },
                {
                    "value": "892800"
                },
                {
                    "value": "904300"
                },
                {
                    "value": "979600"
                },
                {
                    "value": "1069600"
                },
                {
                    "value": "1006600"
                },
                {
                    "value": "1075300"
                },
                {
                    "value": "1170500"
                },
                {
                    "value": "1192100"
                },
                {
                    "value": "1100500"
                },
                {
                    "value": "974200"
                },
                {
                    "value": "936200"
                },
                {
                    "value": "979900"
                },
                {
                    "value": "887400"
                },
                {
                    "value": "1020600"
                }
            ]
        },
        {
            "seriesname": "Nokia",
            "data": [
                {
                    "value": "1174600"
                },
                {
                    "value": "1222800"
                },
                {
                    "value": "1075600"
                },
                {
                    "value": "978700"
                },
                {
                    "value": "1053500"
                },
                {
                    "value": "1117000"
                },
                {
                    "value": "831600"
                },
                {
                    "value": "834200"
                },
                {
                    "value": "823000"
                },
                {
                    "value": "850500"
                },
                {
                    "value": "632200"
                },
                {
                    "value": "609500"
                },
                {
                    "value": "630600"
                },
                {
                    "value": "635800"
                },
                {
                    "value": "496900"
                },
                {
                    "value": "438100"
                },
                {
                    "value": "431300"
                },
                {
                    "value": "330000"
                },
                {
                    "value": "276900"
                },
                {
                    "value": "302900"
                }
            ]
        },
        {
            "seriesname": "Apple",
            "data": [
                {
                    "value": "134800"
                },
                {
                    "value": "160100"
                },
                {
                    "value": "168800"
                },
                {
                    "value": "196300"
                },
                {
                    "value": "173000"
                },
                {
                    "value": "354600"
                },
                {
                    "value": "331200"
                },
                {
                    "value": "289400"
                },
                {
                    "value": "246200"
                },
                {
                    "value": "434600"
                },
                {
                    "value": "383300"
                },
                {
                    "value": "319000"
                },
                {
                    "value": "303300"
                },
                {
                    "value": "502200"
                },
                {
                    "value": "430600"
                },
                {
                    "value": "353500"
                },
                {
                    "value": "381900"
                },
                {
                    "value": "601800"
                },
                {
                    "value": "480900"
                },
                {
                    "value": "460600"
                }
            ]
        }
    ]
}
<html>
<head>
<title>My first chart using FusionCharts Suite XT</title>
<script type="text/javascript" src="http://static.fusioncharts.com/code/latest/fusioncharts.js"></script>
<script type="text/javascript" src="http://static.fusioncharts.com/code/latest/themes/fusioncharts.theme.fint.js?cacheBust=56"></script>
<script type="text/javascript">
FusionCharts.ready(function(){
var fusioncharts = new FusionCharts({
type: 'msline',
renderAt: 'chart-container',
width: '600',
height: '400',
dataFormat: 'json',
dataSource: {
"chart": {
"caption": "Worldwide Smartphone Sales to End Users from 2011 to 2015",
"subcaption": "By Top 3 Vendors",
"linethickness": "2",
"numberPrefix": "$",
"showvalues": "0",
"formatnumberscale": "1",
"labeldisplay": "ROTATE",
"slantlabels": "1",
"divLineAlpha": "40",
"anchoralpha": "0",
"animation": "1",
"legendborderalpha": "20",
"drawCrossLine": "1",
"crossLineColor": "#0d0d0d",
"crossLineAlpha": "100",
"tooltipGrayOutColor": "#80bfff",
"theme": "zune"
},
"categories": [{
"category": [{
"label": "Q1'12"
},
{
"label": "Q2'12"
},
{
"label": "Q3'12"
},
{
"label": "Q4'12"
},
{
"label": "Q1'13"
},
{
"label": "Q2'13"
},
{
"label": "Q3'13"
},
{
"label": "Q4'13"
},
{
"label": "Q1'14"
},
{
"label": "Q2'14"
},
{
"label": "Q3'14"
},
{
"label": "Q4'14"
},
{
"label": "Q1'15"
},
{
"label": "Q2'15"
},
{
"label": "Q3'15"
},
{
"label": "Q4'15"
},
{
"label": "Q1'16"
},
{
"label": "Q2'16"
},
{
"label": "Q3'16"
},
{
"label": "Q4'16"
}
]
}],
"dataset": [{
"seriesname": "Samsung",
"data": [{
"value": "716000"
},
{
"value": "771700"
},
{
"value": "687800"
},
{
"value": "698300"
},
{
"value": "826100"
},
{
"value": "938300"
},
{
"value": "892800"
},
{
"value": "904300"
},
{
"value": "979600"
},
{
"value": "1069600"
},
{
"value": "1006600"
},
{
"value": "1075300"
},
{
"value": "1170500"
},
{
"value": "1192100"
},
{
"value": "1100500"
},
{
"value": "974200"
},
{
"value": "936200"
},
{
"value": "979900"
},
{
"value": "887400"
},
{
"value": "1020600"
}
]
},
{
"seriesname": "Nokia",
"data": [{
"value": "1174600"
},
{
"value": "1222800"
},
{
"value": "1075600"
},
{
"value": "978700"
},
{
"value": "1053500"
},
{
"value": "1117000"
},
{
"value": "831600"
},
{
"value": "834200"
},
{
"value": "823000"
},
{
"value": "850500"
},
{
"value": "632200"
},
{
"value": "609500"
},
{
"value": "630600"
},
{
"value": "635800"
},
{
"value": "496900"
},
{
"value": "438100"
},
{
"value": "431300"
},
{
"value": "330000"
},
{
"value": "276900"
},
{
"value": "302900"
}
]
},
{
"seriesname": "Apple",
"data": [{
"value": "134800"
},
{
"value": "160100"
},
{
"value": "168800"
},
{
"value": "196300"
},
{
"value": "173000"
},
{
"value": "354600"
},
{
"value": "331200"
},
{
"value": "289400"
},
{
"value": "246200"
},
{
"value": "434600"
},
{
"value": "383300"
},
{
"value": "319000"
},
{
"value": "303300"
},
{
"value": "502200"
},
{
"value": "430600"
},
{
"value": "353500"
},
{
"value": "381900"
},
{
"value": "601800"
},
{
"value": "480900"
},
{
"value": "460600"
}
]
}
]
}
});
fusioncharts.render();
});
</script>
</head>
<body>
<div id="chart-container">FusionCharts XT will load here!</div>
</body>
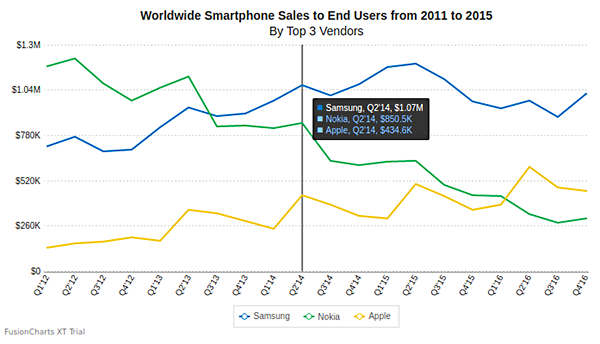
</html>In the above chart, by default the plotColorInTooltip attribute has been set to 1. Set plotColorInTooltip: 0, to turn off the color of the plot in the tooltip as shown in the image below:

Apply tooltipGrayOutColor attribute to specify the color of the unfocused plot in the tooltip. In the image below the label color of the unfocused plot in the tooltip has been set to #3377ff as shown in the image below:

The consolidated tooltip can be customized using following attributes:
| Attribute | Description |
|---|---|
|
It specifies whether to display the color of the plots with labels in the tooltip. If you do not want to display the color, set this to |
|
It specifies the color of the unfocused plot in the tooltip for all multi-series charts. Accepts hex code. e.g. |
|
Specify background Color for tooltip. Accepts hex code, e.g., |
|
Specify tooltip border color. Accepts hex code. e.g. |
|
The character specified as the value of this attribute separates the name and value displayed in tooltip. Accepts any string. e.g. |
|
Set the value to |

