Exporting Charts
FusionTime allows you export your rendered charts in JPG, PNG, SVG, PDF and XLS formats.
In this article we will discuss how to export time-series charts in FusionTime.
A server-side helper library enables export by conveting the SVG to the required format. You can also export VML as it is converted to SVG internally before exporting. During the export process, the data to be exported is first sent to the FusionCharts servers to be processed, finally generating the output in the required format.
When charts are exported on the client side, the entire exporting process is carried out using the user’s browser.
You must have an active internet connection for this feature to work.
Thr dropdown menu with export options looks like as shown below:
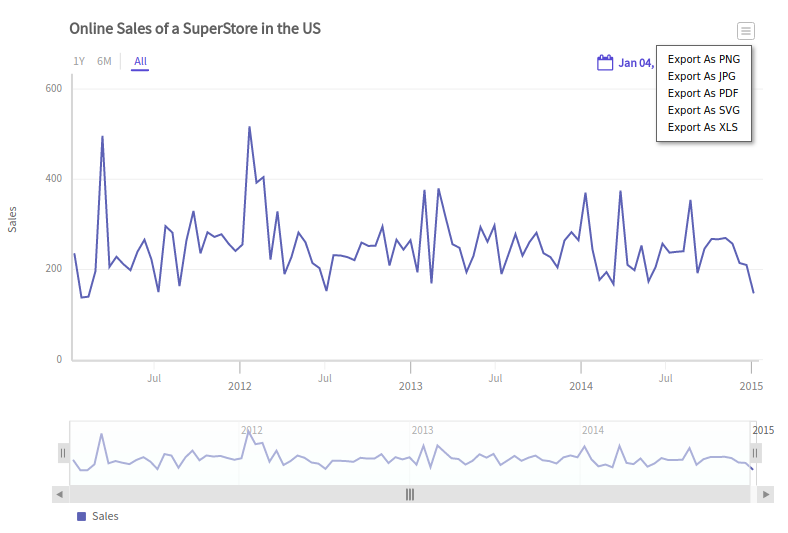
To enable export:
Set the
exportEnabledattribute to1under chart level.The
 (menu) button is then visible on the top-right corner of the chart.
Hover over this button to see the dropdown menu with export options. From the menu, select the required format. The chart is exported to your machine in the selected format.
A time-series chart with export enabled is shown below. Hover over the (menu) button and select the required export format.
To enable the export feature, refer to the code below:
new FusionCharts({
    type: 'timeseries',
    ...
    dataSource: {
        ...
        chart: {
            exportEnabled: '1' //Enable Export Feature
        },
        ...
    }
})In the above code we have:
- Set the value of the
exportEnabledattribute to1under thechartobject