Y-Axis
In FusionTime, the yAxis object can be specified within the dataSource object of the FusionCharts constructor.
It will accept inputs in two forms - an array of yAxis objects or an array of Strings.
An example of array of yAxis objects is shown in the code below:
yAxis: [{
    plot: {
        value: 'Sales',
    },
}, {
    plot: {
        value: 'Shipping Cost',
    }
}],
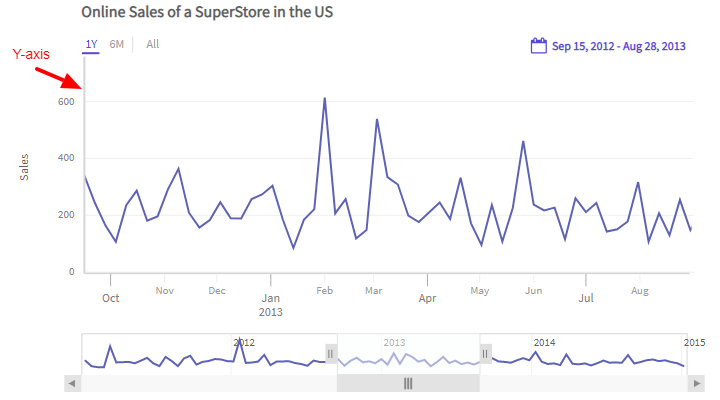
Refer to the image below:
An array of strings is applicable when you want to provide different configurations for multiple canvases. Refer to the code below:
"yAxis": [{
    "plot": ["Sales", "Shipping Cost"]
}]Refer to the chart below:
FusionTime will load here..
To configure the y-axis you can:
- Set the column name using the
valueattribute under theplotobject to specify the column which is mapped to the y-axis. - Set the y-axis title using the
titleattribute under theyAxisobject. - Set the suffix and prefix of the y-axis values using the
suffixandprefixattributes under theformatobject within theyAxisobject.
Refer to the code below:
yAxis: [{
    plot: {
        "value": "Sales",
    },
    "title": "Total Sales",
}, {
    format: {
        "prefix": "$",
    }
}],Was this article helpful to you ?