Time Navigator
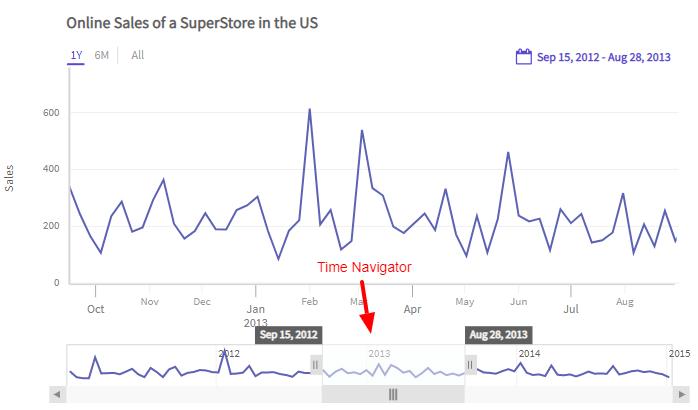
In FusionTime, the time navigator facilitates you to focus on details in a specific time period while still staying in context of the whole timeline. The time navigator plots the complete data in a rectangular box below the time axis.
The time navigator is shown in the image below:
The major features of Time Navigator include the following:
Shows the entire underlying data (including all data series) as data plots.
Has a scroll bar with scroll buttons at both the ends.
Has an active window with a pair of draggable handles which you can use to display the selected time period.
You can pan the active window of the time navigator to view the data of a specific section compared to the complete data.
The active window of the time navigator resizes itself every time you perform a relevant action, such as zoom in/out of the chart, select standard time periods from the standard range selector, change the date/time in the custom range selector, etc.
The chart canvas updates automatically every time you make a selection using the handles of the Time Navigator.
In case of multivariate charts, there is only one common time navigator for all the canvases.
In this article, we will discuss about the different interactions of the time navigator and how to hide the time navigator.
Zoom in/out
You can use the handles on either side to select a time period. The data plot in the canvas zooms in/out respectively. This behavior is also applicable when you zoom in/out from the chart canvas, i.e., with the interaction in the chart canvas the time navigator gets updated accordingly. Refer to the image below:
Pan the active window
You can pan the active window across the time navigator and see the data plots in the canvas update accordingly. Refer to the image below:
Active window labels
When you hover the mouse pointer on the active window of the time navigator, the time labels appear on the both the ends of the active window showing the start date/time and the end date/time. You can drag these labels to change the active window. Refer to the image below:
Show/Hide Time Navigator
By default, FusionTime shows the Time Navigator at the bottom of the chart. However, if you don't want to display the Time Navigator, you can hide it using the enableNavigator attribute within the chart object.
Refer to the code below:
new FusionCharts({
        type: 'timeseries',
        ...
        dataSource: {
            chart: {
                "enableNavigator": "0", // Disables time Time Navigator
            },
        }
});