Data Markers
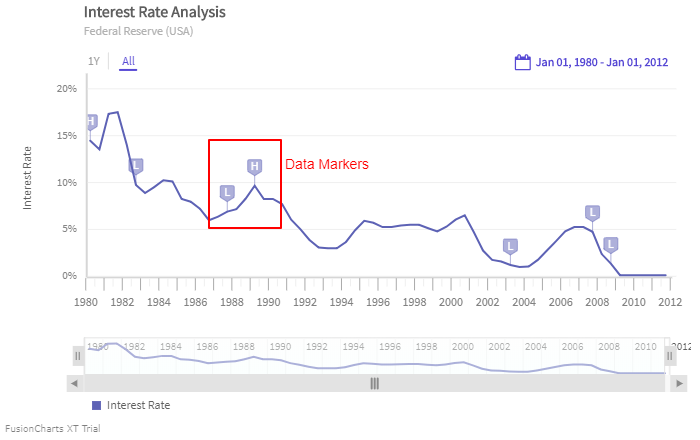
Data marker in a chart represents an important event, which occurred on a specific data point. Hovering on a data marker shows additional description of the event in the tooltip.
The image below shows the data marker on a time series chart:
Create Data Markers
To create data Markers follow the setps given below:
Create a
dataMarkerobject.Within the
dataMarkerobject use theseriesNameattribute to specify the exact name of the series, against which the data marker will be displayed. If you need to mention the exact name of the series as a combination of a series name and a measure name, then specify it in the format<series_name>-<measure_name>.Within the
dataMarkerobject use thetimeattribute to set the time instance on which the data marker will be displayed.Within the
dataMarkerobject use thetimeFormatattribute to set the format of the date/time corresponding to the marker.Within the
dataMarkerobject use thetypeattribute to define the type of the marker asflag.Within the
dataMarkerobject use theidentifierattribute to set the character to be displayed within the marker.Within the
dataMarkerobject use thetooltextattribute to set the text to be displayed in the tooltip, when you hover the mouse pointer over the data marker.
Refer to the code given below:
dataMarker: [{
    seriesName: "Interest Rate",
    time: "Mar-1980",
    identifier: "H",
    timeFormat: "%b-%Y",
    tooltext: "As a part of credit control program, under the leadership of Paul Volcker, the Fed tightened the money supply, allowing the federal fund rates to approach 20 percent."
}, {
    seriesName: "Interest Rate",
    time: "Aug-1982",
    identifier: "L",
    timeFormat: "%b-%Y",
    tooltext: "The FED eases off the monetary brakes, allowing interest rates to fall and the economy to begin a strong recovery."
}, {
    seriesName: "Interest Rate",
    time: "Oct-1987",
    identifier: "L",
    timeFormat: "%b-%Y",
    tooltext: "The FED is forced to ease rate after the stock market crash."
}, {
    seriesName: "Interest Rate",
    time: "May-1989",
    identifier: "H",
    timeFormat: "%b-%Y",
    tooltext: "Liquidity problem forced the Fed to increase rate to nearly 10%."
}, {
    seriesName: "Interest Rate",
    time: "Sept-1992",
    identifier: "L",
    timeFormat: "%b-%Y",
    tooltext: "To fight the jobless economy growth the Fed had to reduce the interest rate to 3%."
}, {
    seriesName: "Interest Rate",
    time: "Jun-2003",
    identifier: "L",
    timeFormat: "%b-%Y",
    tooltext: "Struggling to revive the economy, the FED cuts it’s benchmark rate to 1%."
}, {
    seriesName: "Interest Rate",
    time: "Sep-2007",
    identifier: "L",
    timeFormat: "%b-%Y",
    tooltext: "Fed started reducing the Federal Fund Rate."
}, {
    seriesName: "Interest Rate",
    time: "Dec-2008",
    identifier: "L",
    timeFormat: "%b-%Y",
    tooltext: "Fed reduced the interest rates to sub 0.25% to manage the menace of longest economic downturn since World War 2"
}],The data marker created using the above code is shown below: