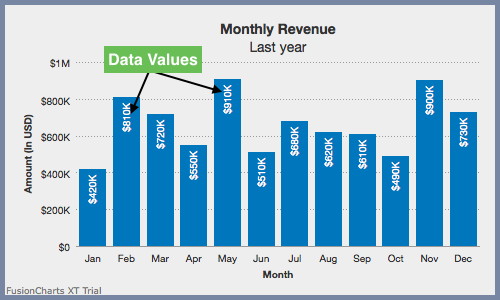
Data Values
Data values are plot values, i.e. values of each data plot (line, column, bar, pie) displayed on the chart.
Configure Text Labels instead of Numeric Data Values
Instead of displaying numeric data values, you can use text labels to denote data values for each data item. Specify the text you want to display using the displayValue attribute under data within the particular data plot. Refer to the code below:
{
    "chart": {
        ...
    },
    "data": [
        {
            "label": "Q1",
            "value": "1950000"
        },
        {
            "label": "Q2",
            "value": "1450000"
        },
        {
            "label": "Q3",
            "value": "1730000"
        },
        {
            "label": "Q4",
            "value": "2120000",
            //Custom display string
            "displayValue": "Year's best"
        }
    ]
}The chart will look like as shown below:
Click here to edit the above chart.
Rotate Data Values
By default, the data values appear vertically as shown in the chart below:
Click here to edit the above chart.
You can opt to rotate the data values horizontally. Set the rotateValues to 0 under the chart object. The default value of this attribute is 1.
Refer to the code below:
{
    "chart": {
        "rotateValues": "0"
    }
}The chart will look like as shown below:
Click here to edit the above chart.
Display Data Values outside Columns
By default, the data values are displayed within the column data plots. Set the placeValuesInside attribute to 1 and display the data values inside the column data plots. Refer to the code below:
{
    "chart": {
        "placeValuesInside": "1"
    }
}The chart will look like as shown below:
Click here to edit the above chart.
Show/Hide Data Values
By default, all the data values are hidden. Set the showValues attribute to 1 under the chart object to display all the data values. Refer to the code below:
Hide the data values by setting the following attribute to
0.
{
    "chart": {
        "showValues": "1"
    }
}The chart will look like as shown in the image below:
Click here to edit the above chart.
You can also opt to show/hide specific data values instead of hiding all of them. Set the showValue attribute to 1 under the data for that specific data value which you want to display. This setting overrides the showValues setting at the chart object level.
Refer to the code below:
{
    "chart": {
        "showValues": "0"
    },
    "data": [
        {
            "label": "Q1",
            "value": "1950000",
            "showValue": "1"
        }
    ]
}
The chart looks like as shown below:
Click here to edit the above chart.
Skip Y-axis Values
If there is a large number of values to be displayed along the y-axis, you can opt to display every nth y-axis value skipping the rest.
To do so, specify the n-th level using the yAxisValuesStep attribute. For example, if you set the value as 2, the y-axis will display every 2nd value starting from the minimum value.
This attribute can also assume default values based on the space available in the chart to render y-axis values and can override the values provided to avoid overlapping of y-axis values.
Refer to the code below:
{
    "chart": {
        "yAxisValuesStep": "2"
    }
}The chart will look like as shown below:
Click here to edit the above chart.
Customize Data Value Properties
You can customize the data value properties like font, border, background, and alpha.
Font Properties
To customize the font properties following attributes are used:
Set the font family for the data values using the
valueFontattribute. E.g. -ArialSpecify the hex code for the color of the data values using the
valueFontColorattribute. E.g. -#00ffaa.Set the size of the font using the
valueFontSizeattribute.Set the
valueFontBoldattribute to1to and display the data values asbold.Set the
valueFontItalicattribute to1to and display the data values asitalicsSet the transparency of the data values using the
valueFontAlphaattribute.
Refer to the code below:
{
    "chart": {
        "placeValuesInside": "0",
        "rotateValues": "0",
        "valueFont": "Arial",
        "valueFontColor": "#5d62b5",
        "valueFontSize": "12",
        "valueFontBold": "1",
        "valueFontItalic": "0",
        "valueFontAlpha": "90"
    }
}The chart will look like as shown below:
Click here to edit the above chart.
Customize Data Value Border
To customize the border of the data values, the following attributes are used:
Specify the hex code of the border color using the
valueBorderColorattribute.Set the transparency of the border using the
valueBorderAlphaattribute.Set the thickness of the border using the
valueBorderThicknessattribute.Set the radius if the border using the
valueBorderRadiusattribute.Set the
valueBorderDashedattribute to1to display the border as dashed lines.Specify the gap between two dashed lines using the
valueBorderDashGapattribute.Set the length of each dash using the
valueBorderDashLenattribute.Set the transparency of the border on hover using the
valueBorderHoverAlphaattribute.
Refer to the code below:
{
    "chart": {
        "valueBorderColor": "#666666",
        "valueBorderAlpha": "100",
        "valueBorderPadding": "5",
        "valueBorderRadius": "6",
        "valueBorderThickness": "0.5",
        "valueBorderDashed": "1",
        "valueBorderDashLen": "4",
        "valueBorderDashGap": "2"
    }
}The chart will look like as shown below:
Click here to edit the above chart.
Customize Data Value Background
To customize the background of the data values, the following attributes are used:
Specify the hex code for the background color using the
valueBgColorattribute.Set the transparency of the background using the
valueBgAlphaattribute.Set the transparency of the background on hover using the
valueBgHoverAlphaattribute.
Refer to the code below:
{
    "chart": {
        "valueBgColor": "#666666",
        "valueBgAlpha": "100",
    }
}The chart will look like as shown below:
Click here to edit the above chart.