Installation
FusionCharts Suite XT includes the FusionCharts server-side Django wrapper that lets you create interactive, data-driven charts. Using the wrapper, you can create charts in your browsers without writing any JavaScript code. The required JavaScript and HTML code is generated as a string in the server and inserted in the web page for generating charts.
In this article, we will show you how you can download and install the FusionCharts Django wrapper and all the other dependencies on your system.
The FusionCharts Django wrapper requires Python 2.7 or higher version.
Install the FusionCharts Django Wrapper
In order to install and start working with Django-FusionCharts, you need to download the FusionCharts Suite XT package which contains:
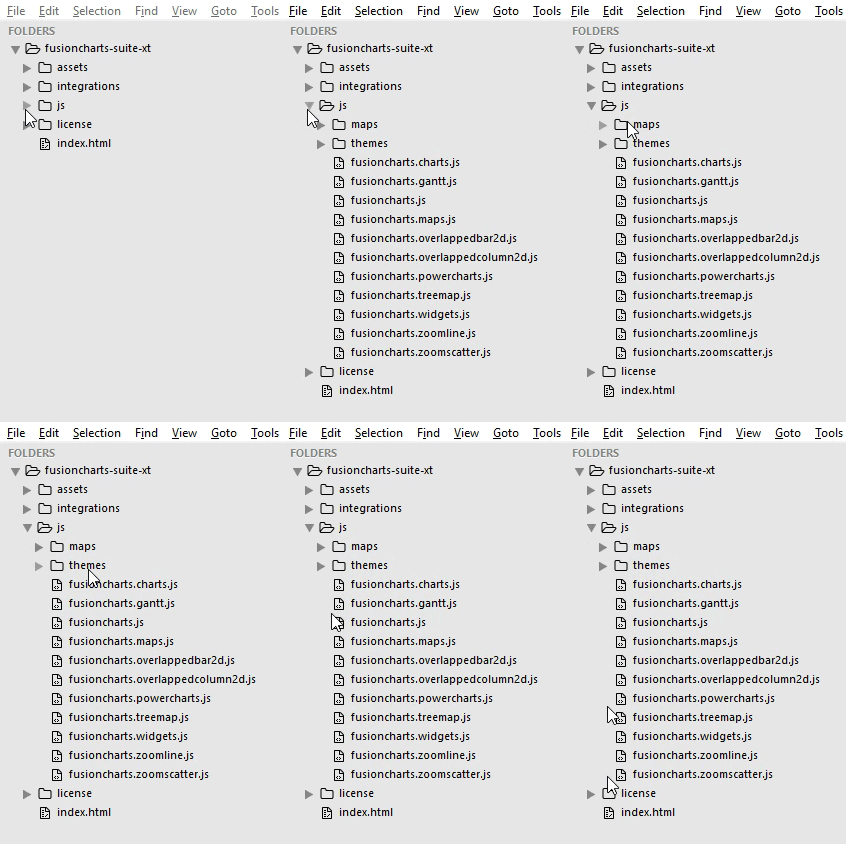
- JavaScript files to render Charts, Widgets, and PowerCharts in the
jsfolder. - JavaScript files to render maps in the
js > mapsfolder. - JavaScript files to apply themes in the
js > themesfolder.
The folder structure is shown below:

You need to copy all the files/folders from
fusioncharts-suite-xt > jsfolder to the STATIC folder of your application.
- The download package also contains fusioncharts.py file in the
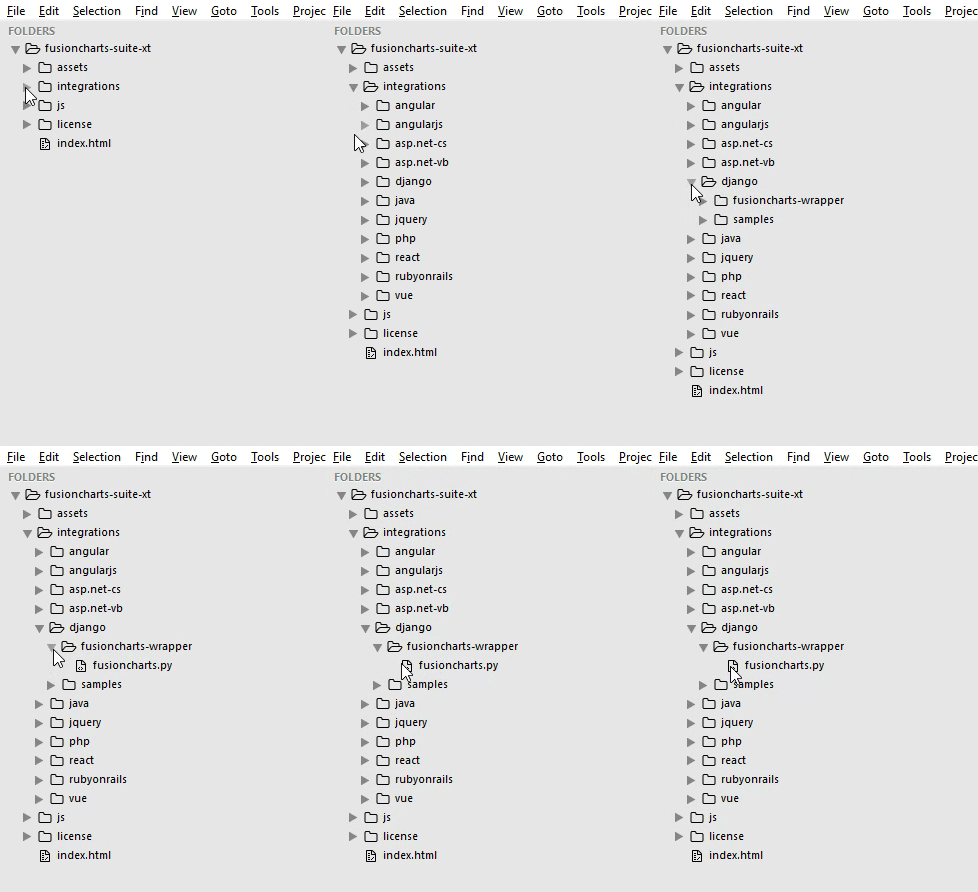
fusioncharts-suite-xt > integrations > django > fusioncharts-wrapperfolder. The folder structure is shown below:

The
djangofolder in the FusionCharts Suite XT package is available from v3.13.0.
You need to copy the
fusioncharts.pyfile fromfusioncharts-suite-xt > integrations > django > fusioncharts-wrapperto theSTATICfolder in your project's folder.
Following is the list of JavaScript files present in your fusioncharts-suite-xt > js folder:
| File Name | Description | |
|---|---|---|
fusioncharts.js |
This is the core FusionCharts library, which you need to import in all your pages where you want to generate a chart, gauge or a map. | |
fusioncharts.charts.js |
This file is required to render all charts present under FusionCharts XT. Note: When you include fusioncharts.js file in your page, you do not need to include this file separately, as fusioncharts.js internally loads fusioncharts.charts.js provided they are in the same folder. |
|
fusioncharts.widgets.js |
This file is required to render all gauges present under FusionWidgets XT. Note: When you include fusioncharts.js file in your page, you do not need to include this file separately, as fusioncharts.js internally loads fusioncharts.widgets.js provided they are in the same folder. |
|
fusioncharts.powercharts.js |
This file is required to render all charts present under PowerCharts XT. Note: When you include fusioncharts.js file in your page, you do not need to include this file separately, as fusioncharts.js internally loads fusioncharts.powercharts.js provided they are in the same folder. |
|
fusioncharts.gantt.js |
This file is required to render the Gantt chart. Note: When you include fusioncharts.js file in your page, you do not need to include this file separately, as fusioncharts.js internally loads fusioncharts.gantt.js provided they are in the same folder. |
|
fusioncharts.treemap.js |
This file is required to render the Treemap. Note: When you include fusioncharts.js file in your page, you do not need to include this file separately, as fusioncharts.js internally loads fusioncharts.treemap.js provided they are in the same folder. |
|
fusioncharts.zoomscatter.js |
This file is required to render the Zoom scatter chart. Note: When you include fusioncharts.js file in your page, you do not need to include this file separately, as fusioncharts.js internally loads fusioncharts.zoomscatter.js provided they are in the same folder. |
|
fusioncharts.zoomline.js |
This file is required to render the Zoom line charts. Note: When you include fusioncharts.js file in your page, you do not need to include this file separately, as fusioncharts.js internally loads fusioncharts.zoomline.js provided they are in the same folder. |
|
fusioncharts.overlappedbar2d.js |
This file is required to render the Overlapped Bar 2D chart. Note: When you include fusioncharts.js file in your page, you do not need to include this file separately, as fusioncharts.js internally loads fusioncharts.overlappedbar2d.js provided they are in the same folder. |
|
fusioncharts.overlappedcolumn2d.js |
This file is required to render the Overlapped Column 2D chart, present under FusionCharts XT. Note: When you include fusioncharts.js file in your page, you do not need to include this file separately, as fusioncharts.js internally loads fusioncharts.overlappedcolumn2d.js provided they are in the same folder. |
|
fusioncharts.maps.js |
This file is the core map renderer file. The map definitions, however, are stored separately, as explained next. Note: When you include fusioncharts.js file in your page, you do not need to include this file separately, as fusioncharts.js internally loads fusioncharts.maps.js provided they are in the same folder. |
|
maps/* |
This folder contains Map Definition files required by each map to be rendered by fusioncharts.maps.js. To keep the download package size small, it contains only 2 maps - fusioncharts.world.js and fusioncharts.usa.js. You can download the definition files of all the 1400+ maps offered by FusionMaps XT from here . Note: Replace the map definition files (of v3.12.2 or older) with the latest files available in download package while upgrading to v3.13.0. |
|
themes/* |
This folder contains pre-packaged themes that can be applied to charts, gauges, and maps to style them through a central FusionCharts theme files. Refer each theme with their respective JavaScript file names. |
To install FusionCharts Suite XT, simply copy and paste the JavaScript files from the downloaded package into your project folder.
After that, you can include the FusionCharts JavaScript library in your web applications and start building your charts, gauges, and maps. Configure your STATIC_ROOT path and follow the steps given below:
Step 1: Assuming you have already configured your STATIC_ROOT path, place the FusionChart library inside the static > FusionCharts folder in your project.
Step 2 (optional): Include the theme files in the static > FusionCharts folder in your project.
Add the following code to templates > index.html file:
{% load static %}
<script type="text/javascript" src="{% static "path/to/local/fusioncharts.js" %}"></script>
<script type="text/javascript" src="{% static "path/to/local/themes/fusioncharts.theme.fusion.js" %}"></script>This completes the installation of FusionCharts in your application. To see how to create a chart, click here .
Installing FusionMaps for your project
FusionCharts Suite XT provides 1400+ data-driven maps as a part of the FusionMaps product. To reduce the size of the download package, we have included the fusioncharts.maps.js file and only two map definition files - the World Map, and the Map of USA. However, you can download the remaining map definition files to plot maps of those countries/regions.
If you are using version v3.12.2 or older, download the latest version and replace for upgrading to the latest map definition files.
To render a map, you need to:
- Include the
fusioncharts.jsfile (core FusionCharts library)templates > index.html. - Include the
fusionmaps.jsfile to thetemplates > index.htmlfile. - Include the
fusioncharts.world.jsfile to thetemplates > index.htmlfile.
Refer to the code below:
{% load static %}
<script type="text/javascript" src="{% static "fusioncharts/fusioncharts.js" %}"></script>
<script type="text/javascript" src="{% static "fusioncharts/fusionmaps.js" %}"></script>
<script type="text/javascript" src="{% static "fusioncharts/maps/fusioncharts.world.js" %}"></script>In the above example, we’ve included the World Map, whose map definition (path) is contained in maps/fusioncharts.world.js.
Load other Map Definition files
To use any other map (except World and USA) from the 1400+ maps, download the map definition files, then copy those map files to your current maps folder. The map definition files are named in the fusioncharts.[MAP_ALIAS].js format, where MAP_ALIAS represents the country, state or region name.
Insert the <script> tag in templates > index.html file to include the map definition file. The <script> tag is shown below:
<script type="text/javascript" src="path/to/local/maps/fusioncharts.[MAP_ALIAS].js"></script>Therefore, assuming that you need to render the map of California, the alias name california replaces MAP_ALIAS in the format as shown below:
<script type="text/javascript" src="path/to/local/maps/fusioncharts.california.js"></script>Click here to explore all the maps available in FusionMaps XT.
Themes
Themes shipped with FusionCharts Suite XT allow you to apply centralized themes to any number of charts.
In a theme file, we can centralize the following aspects of all of your charts, gauges, and maps:
- Visual appearance (data plot color, font color, font size, etc.)
- Behavior (hover effects for data plots)
- Intelligence (applying different colors to the positive and negative data plots in all charts that use the theme)
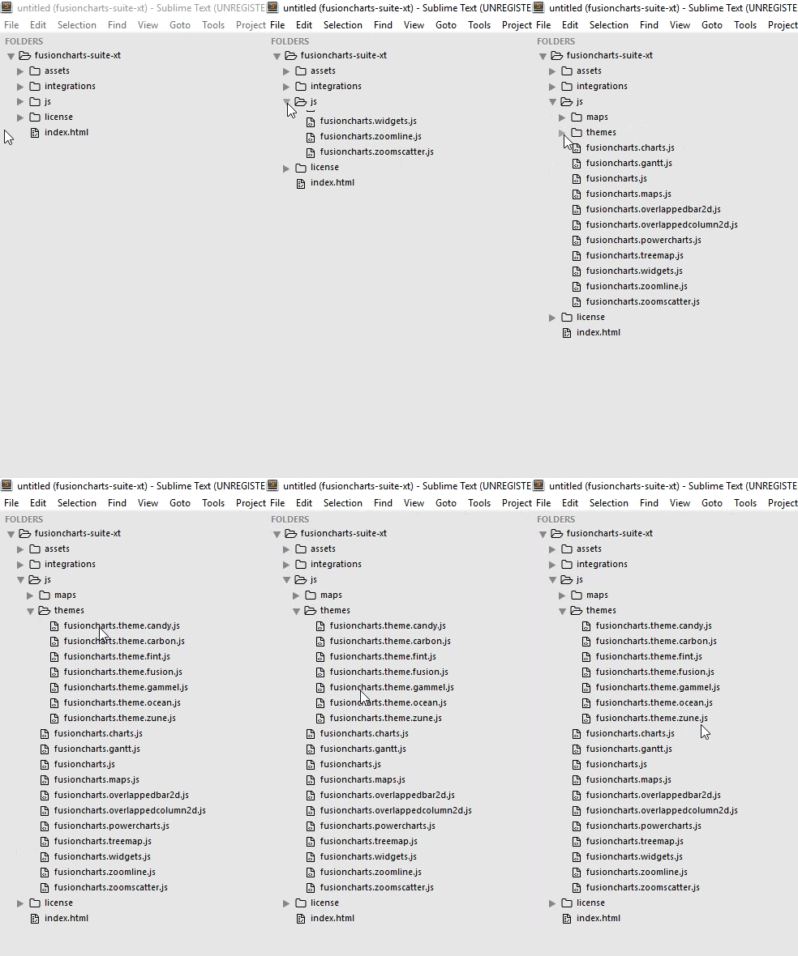
The FusionCharts Suite download package also contains predefined theme files under fusioncharts-suite-xt > js > themes folder. The folder structure is shown below:

Include the theme files in the static > FusionCharts folder in the STATIC folder of your project.
Add the following code to the templates > index.html file:
{% load static %}
<script type="text/javascript" src="{% static "path/to/local/fusioncharts.js" %}"></script>
<script type="text/javascript" src="{% static "path/to/local/themes/fusioncharts.theme.fusion.js" %}"></script>Only including the
fusioncharts.theme.fusion.jsfile will not apply the theme. To apply the theme, set the value ofthemeattribute to the respective theme name. For more details click here .