Key Changes
JavaScript only rendering
FusionCharts Suite XT v3.4 deprecates support for the rendering of charts, gauges, and maps in Adobe Flash. This was done for the following reasons:
- Most modern browsers and devices now support HTML5 rendering and hence JavaScript charts work almost everywhere. This, coupled with the fact that our charts still use VML for older versions of IE, allowed us to deprecate support for Flash.
- To use advanced capabilities offered by the modern browser, without restricting ourselves to the lowest common denominator between the Flash and JavaScript worlds.
- To be compliant with modern web standards.
What this means for you:
- Unified and optimized JavaScript code base of FusionCharts Suite XT that works across browsers and devices. You can be assured the APIs, methods, and events of the charts, gauges, and maps work consistently across browsers and devices. Lesser footprint, in terms of JavaScript file size, without the need for code related to Flash rendering.
- Faster release cycles of FusionCharts Suite XT, now that we have to support only JavaScript rendering.
Read more on this on our blog post here
High performance charts
FusionCharts Suite XT v3.4 boasts of a tremendous improvement in performance of the common charts in the suite, allowing you to build better performing dashboards for your desktops and mobile devices.
Dependency on jQuery removed
Starting v3.4, FusionCharts Suite XT no more requires jQuery to be included in the page. This was done to avoid conflicts with different versions of jQuery, and additionally to help us reduce the footprint of the JavaScript code, in terms of size, required to generate a chart.
New developer-friendly documentation
While we take great pride in our exhaustive documentation for each product, over the years, the documentation acquired a split personality problem - serving both the Flash chart users and JavaScript chart users. With v3.4 no more supporting Flash, it was a great opportunity for us to redo the entire documentation from a JavaScript developer's perspective. The entire content has been rewritten keeping in mind the needs of a JavaScript developer, including the new API reference. All the chart examples have also been converted to a modern look and feel by configuring attributes of each chart. Soon, we will also add an in-place Fiddle for you to edit the chart and see the result right in the page.
New Features
Theme Manager to separate data from presentation and further add intelligence to charts
Until now, to build a chart using FusionCharts Suite XT, you had to provide both, the data and the configuration details, in the same JSON or XML file. The Theme Manager allows you to separate this into different files - the data file and the theme file. The theme file can be reused for multiple charts in your application. In fact, FusionCharts Suite XT allows you to define multiple theme files for each chart, which follows an inheritance chain. This can be useful when you have a base theme for the entire application, but wish to override a few attributes for a subset of charts. Theme files are defined in JSON, allowing you to define attributes for all charts, or specific charts. You can even take it a step further by applying conditional functional logic, for example, having separate coloring for negative and positive data points, highlighting data points at a specific index or if they cross a certain threshold of value. The possibilities are endless!
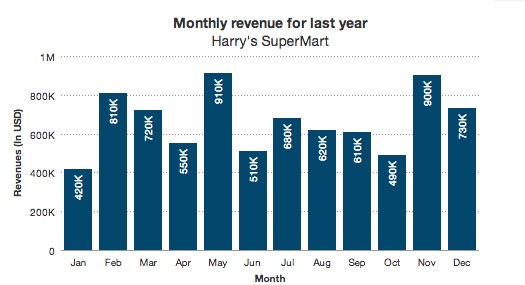
Shown below is how they would appear with the new ocean theme applied.
Simple. Isn't it? If you are curious to know how the themes work click here
Annotations engine to add custom shapes and text on chart
FusionCharts Suite XT v3.4 allows you to add custom shapes and text on the chart, and even bind them to data points or pre-defined points on the charts through macro variables. Additionally, these can be hooked to various chart events in JavaScript, allowing you to build highly interactive and customized visualizations suited to your needs. This feature was earlier available only in FusionWidgets XT but has now been extended to support events and programmatic control through JavaScript API, and then applied to all the charts and gauges in FusionCharts Suite XT (except the Gantt chart). Possible use cases could include showing or hiding of custom shapes upon mouse events, or adding additional information to a data point.
Additional events available for deeper integration of charts with your applications or JavaScript frameworks
With the move to JavaScript-only rendering, the FusionCharts Suite XT offers a lot more events for you to listen to, for deeper integration with your application. Some of the new events include mouse rollover and rollout for data points and chart area, events for annotation elements, events for data loading cycles, etc.
All common charts now support hover effect for data points.
This helps in reducing the cognitive load of the end viewer of chart as he or she sifts through the data. JavaScript events are raised whenever the user hovers over or out of a data plot, so that you can customize the user’s experience, centered around data.
Support for macro variables in tooltips to support dynamic content
Tooltips now support macro variables that allow you to build custom tool-text for the data points on a chart. Each chart exposes labels, raw values, formatted values, display values etc. as variables that can be used in conjunction with your custom text to form the complete tool-text.
Data-enabled markers for maps
You can now bind markers in FusionMaps XT to dynamic values, wherein they increase or decrease the size of the marker to reflect the data values. This lets you build data-driven geo-visualizations.
Selectively render axis lines
You can now select which axis lines (borders of the canvas) to render, thus allowing you to gain a finer control over the look and feel of the chart. The chart can be easily configured to have minimal elements that purists like, or can be configured to show all the details you need.
New JavaScript helper methods available
The helper methods allow you to do various things like getting the formatted string for a number, changing an existing chart type etc.
General Improvements
- Cleaner legend icons across all charts
- Option to hide specific datasets upon chart initial load, which can be shown by user upon clicking legend key
- Pie and doughnut charts can now be configured to allow slicing of only one pie/doughnut slice at most
- Doughnut charts can now contain a dynamic center label, which can be configured per doughnut slice
- Better export server hosted by FusionCharts Suite XT, for export of charts as image/PDF
- Support for
paletteThemeColorsacross the suite, allowing you to define a list of colors for use by data plots - Support for automatic ellipses and wrapping in ZoomLine charts
- Anchors in charts now support the hover effect
- New attributes for anchors to better configure their display such as image, shadow etc
- Support for tooltips for the connectors in the Drag Node charts
- Support for path in annotations
- Unification of limit calculation in gauges, which was earlier bound by color-range minimum or maximum values
- Aesthetics of axis, data plot, anchors etc.