Change Chart Type at Runtime
FusionCharts Suite XT includes advanced features that add more context to your chart and simplify data visualization. These features include chart updates, update chart type at runtime, and events.
This article focuses on how to change the chart type of the chart at runtime using the flutter-fusioncharts component. The chart types used in the sample are:
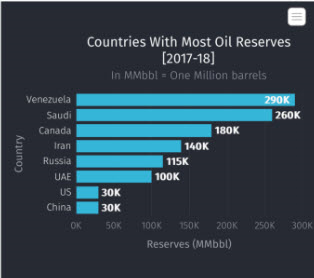
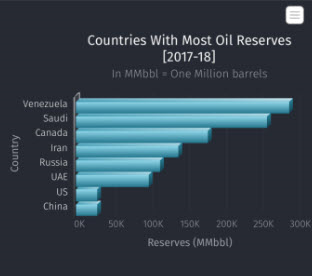
Here is an example of a 2D Bar chart configured to change to a 3D Bar chart type.


The complete code of the above sample is given below:
import 'package:flutter/foundation.dart';
import 'package:flutter/material.dart';
import 'package:flutter_fusioncharts/flutter_fusioncharts.dart';
import '../../constants.dart';
class ColumnChart extends StatefulWidget {
const ColumnChart({super.key});
@override
State<ColumnChart> createState() => _ColumnChartState();
}
class _ColumnChartState extends State<ColumnChart> {
late FusionCharts _fusionChart2D;
FusionChartsController fusionChartsController = FusionChartsController();
@override
void initState() {
super.initState();
Map<String, dynamic> chart = {
"caption": "Countries With Most Oil Reserves [2017-18]",
"subCaption": "In MMbbl = One Million barrels",
"logoURL":
"https://static.fusioncharts.com/sampledata/images/Logo-HM-72x72.png",
"logoAlpha": "100",
"logoScale": "110",
"logoPosition": "TL",
"xAxisName": "Country",
"yAxisName": "Reserves (MMbbl)",
"exportenabled": "1",
"numberSuffix": "K",
"theme": "carbon",
"baseFontSize": "35px",
"captionFontSize": "35px",
"subCaptionFontSize": "30px"
};
List<dynamic> chartData = [
{"label": "Venezuela", "value": "290"},
{"label": "Saudi", "value": "260"},
{"label": "Canada", "value": "180"},
{"label": "Iran", "value": "140"},
{"label": "Russia", "value": "115"},
{"label": "UAE", "value": "100"},
{"label": "US", "value": "30"},
{"label": "China", "value": "30"}
];
Map<String, dynamic> dataSource = {"chart": chart, "data": chartData};
_fusionChart2D = FusionCharts(
dataSource: dataSource,
type: "column2d",
width: "100%",
height: "100%",
events: const ['chartClick'],
fusionChartEvent: callBackFromPlugin,
fusionChartsController: fusionChartsController,
licenseKey: licenseKey,
isLocal: false,
);
}
void callBackFromPlugin(senderId, eventType) {
if (kDebugMode) {
print('Event Back to consumer: $senderId , $eventType');
}
}
@override
Widget build(BuildContext context) {
return Scaffold(
appBar: AppBar(
leading: IconButton(
icon: const Icon(Icons.arrow_back),
onPressed: () => Navigator.of(context).pop()),
title: const Text('Fusion Charts - Column'),
),
body: SizedBox(
height: MediaQuery.of(context).size.height / 2,
child: _fusionChart2D),
);
}
}
These are the steps to follow to render the sample chart above.
Include the necessary libraries and components using
import. For example,flutter-fusioncharts,fusioncharts, etc.Define the chart configuration in a JSON object. In the JSON object:
- Set the chart type as
column2d. Find the complete list of chart types with their respective alias here. - Set the width and height of the chart in pixels.
- Set the
dataFormatas JSON. - Embed the json data as the value of
dataSource.
- Set the chart type as
Specify the location of
fusioncharts.htmlfor Android and iOS.Create a function to update the chart type at runtime.
Add the
render()function to create the radio buttons.Add
styleto the container of the chart.
The HTML template(fusioncharts.html) of the above sample is:
<!DOCTYPE html>
<html>
<head>
<title>FusionCharts</title>
<meta http-equiv="content-type" content="text/html; charset=utf-8">
<meta name="viewport" content="width=device-width, initial-scale=1.0, user-scalable=no" />
<style type="text/css">
body,
html {
margin: 0;
padding: 0;
overflow: hidden;
font-size: 13px;
}
#chart-container {
width: 100%;
height: 100%;
top: 0;
left: 0;
right: 0;
bottom: 0;
position: absolute;
user-select: none;
-webkit-user-select: none;
overflow: hidden;
}
#loading-text {
position: absolute;
top: 50%;
left: 50%;
transform: translate(-50%, -50%);
-webkit-transform: translate(-50%, -50%);
user-select: none;
-webkit-user-select: none;
}
</style>
</head>
<body>
<div id="chart-container">
<div id="loading-text">
Chart is loading...
</div>
</div>
<script type='text/javascript'>
"use strict";
(function() {
var a = Promise.resolve(),
b = {},
c = {};
(function d() {
var f = function() {
function g() {
return Math.floor(65536 * (1 + Math.random())).toString(16).substring(1)
}
return g() + g() + "-" + g() + "-" + g() + "-" + g() + "-" + g() + g() + g()
};
window.webViewBridge = {
send: function send(g, h, i, j) {
i = i || function() {}, j = j || function() {};
var k = {
targetFunc: g,
data: h || {},
msgId: f()
},
l = JSON.stringify(k);
a = a.then(function() {
return new Promise(function(m, n) {
b[k.msgId] = {
resolve: m,
reject: n
}, c[k.msgId] = {
onsuccess: i,
onerror: j
}, window.postMessage(l)
})
}).catch(function() {})
}
}, window.document.addEventListener("message", function(g) {
var h;
try {
h = JSON.parse(g.data)
} catch (i) {
return
}
b[h.msgId] && (b[h.msgId].resolve(), delete b[h.msgId]), h.args && c[h.msgId] && (h.isSuccessfull ? c[h.msgId].onsuccess.apply(null, h.args) : c[h.msgId].onerror.apply(null, h.args), delete c[h.msgId])
})
})()
})();
</script>
<!-- Include the required FusionCharts modules -->
<script type='text/javascript' src="fusioncharts/fusioncharts.js"></script>
<script type='text/javascript' src="fusioncharts/fusioncharts.charts.js"></script>
<script type='text/javascript' src="fusioncharts/themes/fusioncharts.theme.fusion.js"></script>
</body>
</html>
<!DOCTYPE html>
<html>
<head>
<!-- Include the required FusionCharts modules -->
<script type='text/javascript' src="fusioncharts/fusioncharts.js"></script>
<script type='text/javascript' src="fusioncharts/fusioncharts.charts.js"></script>
<script type='text/javascript' src="fusioncharts/themes/fusioncharts.theme.fusion.js"></script>
</head>
<body></body>
</html>