Adding and Editing Nodes

FusionCharts Suite XT allows you to customize a drag-node chart in run-time - you can add, edit, or delete nodes in a drag-node chart. To avail this feature you need to render the chart in edit mode (edit mode can be enabled by setting "viewMode": "0" in the chart object).

In this section, you will be shown how you can:

  • Add a node at run-time

  • Edit a node at run-time

  • Delete a node at run-time

To understand this, the sample chart that we will use looks like this:

Dragable Node Chart with caption "Railway Map"SantaMonicaLosAngelesOntarioPhoenixFlagstaffBarstowSanDiegoSanYsidroLasVegas Yuma RestoreRailway Map
Add a Node
Add a Label
Add a Connector

The above chart shows the US Subway Map and uses drag-able nodes to mark locations on the map.

The data structure needed to render the above chart is given below:

1
2
3
4
5
6
7
8
9
10
11
12
13
14
15
16
17
18
19
20
21
22
23
24
25
26
27
28
29
30
31
32
33
34
35
36
37
38
39
40
41
42
43
44
45
46
47
48
49
50
51
52
53
54
55
56
57
58
59
60
61
62
63
64
65
66
67
68
69
70
71
72
73
74
75
76
77
78
79
80
81
82
83
84
85
86
87
88
89
90
91
92
93
94
95
96
97
98
99
100
101
102
103
104
105
106
107
108
109
110
111
112
113
114
115
116
117
118
119
120
121
122
123
124
125
126
127
128
129
130
131
132
133
134
135
136
137
138
139
140
141
142
143
144
145
146
147
148
149
150
151
152
153
154
155
156
157
158
159
160
161
162
163
164
165
166
167
168
169
170
171
172
173
174
175
176
177
178
179
180
181
182
183
184
185
186
187
188
189
190
191
192
193
194
195
196
197
198
199
200
201
202
203
204
205
206
207
208
209
210
211
212
213
214
215
216
217
218
219
220
221
222
223
224
225
226
227
228
229
230
231
232
233
234
235
236
237
238
239
240
241
242
243
244
245
246
247
248
249
250
251
252
253
254
255
256
257
258
259
260
261
262
263
264
265
266
267
268
{
   "chart": {
      "caption": "Railway Map",
      "xAxisMinValue": "0",
      "xAxisMaxValue": "100",
      "yAxisMinValue": "0",
      "yAxisMaxValue": "100",
      "is3d": "0",
      "showFormBtn": "0",
      "formAction": "files/php/chart-guide-drag-node-chart-adding-and-editing-nodes.php",
      "formTarget": "_blank",
      "formMethod": "POST",
      "viewMode": "0",
      "showPlotBorder": "1",
      "plotBorderThickness": "4",
      "theme": "fint",
      "showCanvasBorder": "1",
      "canvasBorderAlpha": "20"
   },
   "dataset": [
      {
         "data": [
            {
               "id": "01",
               "label": "Santa Monica",
               "color": "#ffffff",
               "x": "16",
               "y": "54",
               "radius": "30",
               "shape": "circle"
            },
            {
               "id": "02",
               "label": "Los Angeles",
               "color": "#ffffff",
               "x": "27",
               "y": "54",
               "radius": "30",
               "shape": "circle"
            },
            {
               "id": "03",
               "label": "Ontario",
               "color": "#ffffff",
               "x": "48",
               "y": "54",
               "radius": "30",
               "shape": "circle"
            },
            {
               "id": "04",
               "label": "Phoenix",
               "color": "#ffffff",
               "x": "85",
               "y": "54",
               "radius": "30",
               "shape": "circle"
            },
            {
               "id": "05",
               "label": "Flagstaff",
               "color": "#ffffff",
               "x": "85",
               "y": "80",
               "radius": "30",
               "shape": "circle"
            },
            {
               "id": "06",
               "label": "Barstow",
               "color": "#ffffff",
               "x": "62",
               "y": "80",
               "radius": "30",
               "shape": "circle"
            },
            {
               "id": "07",
               "label": "San Diego",
               "color": "#ffffff",
               "x": "35",
               "y": "30",
               "radius": "30",
               "shape": "circle"
            },
            {
               "id": "08",
               "label": "San Ysidro",
               "color": "#ffffff",
               "x": "40",
               "y": "12",
               "radius": "30",
               "shape": "circle"
            },
            {
               "id": "09",
               "label": "Las Vegas",
               "color": "#ffffff",
               "x": "68",
               "y": "93",
               "radius": "30",
               "shape": "circle"
            },
            {
               "id": "10",
               "label": "",
               "color": "#ffffff",
               "x": "12",
               "y": "98",
               "radius": "0",
               "shape": "circle"
            },
            {
               "id": "11",
               "label": "",
               "color": "#ffffff",
               "x": "100",
               "y": "80",
               "radius": "0",
               "shape": "circle"
            },
            {
               "id": "12",
               "label": "",
               "color": "#ffffff",
               "x": "99",
               "y": "40",
               "radius": "0",
               "shape": "circle"
            },
            {
               "id": "13",
               "label": "Yuma",
               "color": "#ffffff",
               "x": "70",
               "y": "30",
               "radius": "30",
               "shape": "circle"
            },
            {
               "id": "14",
               "label": "",
               "color": "#ffffff",
               "x": "100",
               "y": "30",
               "radius": "0",
               "shape": "circle"
            }
         ]
      }
   ],
   "connectors": [
      {
         "color": "#ffffff",
         "stdThickness": "20",
         "connector": [
            {
               "from": "01",
               "to": "02",
               "color": "#fec110",
               "arrowAtStart": "0",
               "arrowAtEnd": "0"
            },
            {
               "from": "02",
               "to": "03",
               "color": "#fec110",
               "arrowAtStart": "0",
               "arrowAtEnd": "0"
            },
            {
               "from": "03",
               "to": "04",
               "color": "#fec110",
               "arrowAtStart": "0",
               "arrowAtEnd": "0"
            },
            {
               "from": "04",
               "to": "12",
               "color": "#fec110",
               "arrowAtStart": "0",
               "arrowAtEnd": "0"
            },
            {
               "from": "04",
               "to": "05",
               "color": "#a6aaad",
               "arrowAtStart": "0",
               "arrowAtEnd": "0"
            },
            {
               "from": "09",
               "to": "06",
               "color": "#0178bc",
               "arrowAtStart": "0",
               "arrowAtEnd": "0"
            },
            {
               "from": "06",
               "to": "03",
               "color": "#0178bc",
               "arrowAtStart": "0",
               "arrowAtEnd": "0"
            },
            {
               "from": "03",
               "to": "07",
               "color": "#0178bc",
               "arrowAtStart": "0",
               "arrowAtEnd": "0"
            },
            {
               "from": "05",
               "to": "06",
               "color": "#f1277d",
               "arrowAtStart": "0",
               "arrowAtEnd": "0"
            },
            {
               "from": "06",
               "to": "11",
               "color": "#f1277d",
               "arrowAtStart": "0",
               "arrowAtEnd": "0"
            },
            {
               "from": "02",
               "to": "07",
               "color": "#c1c733",
               "arrowAtStart": "0",
               "arrowAtEnd": "0"
            },
            {
               "from": "07",
               "to": "08",
               "color": "#c1c733",
               "arrowAtStart": "0",
               "arrowAtEnd": "0"
            },
            {
               "from": "02",
               "to": "10",
               "color": "#c1c733",
               "arrowAtStart": "0",
               "arrowAtEnd": "0"
            },
            {
               "from": "07",
               "to": "13",
               "color": "#6d6e70",
               "arrowAtStart": "0",
               "arrowAtEnd": "0"
            },
            {
               "from": "13",
               "to": "14",
               "color": "#6d6e70",
               "arrowAtStart": "0",
               "arrowAtEnd": "0"
            }
         ]
      }
   ],
   "labels": {
      "label": []
   }
}
...

Adding a Node at Run-time

To the above subway map chart, we will now add a new node.

To add a node to:

  1. From the bottom-left corner of the chart, click the image add-node-image-1 button. A menu is rendered.

  2. From the menu, select the Add a node option.

image add-node-image-2

The node properties dialog box, as seen in the image below, is shown:

image add-node-image-3

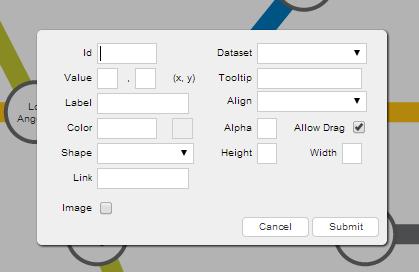
  1. In this dialog box, enter the node information.

  2. Click Submit.

Given below is a brief description of the fields in this dialog box:

Field Description
Id It is used to specify an unique identifier for the node.
Dataset It is used to specify the data set to which the node will belong. The node inherits all visual properties defined for the data set.
Label It is used to specify the label for the node. The label will be displayed on the chart.
Value It is used to specify the x- and y-coordinates for the node position.
Tooltip It is used to specify the tool-tip text for the node.
Color It is used to specify the hex code of the color that will be applied to the node.
Alpha It is used to specify the transparency for the node. This field takes values between 0 (transparent) and 100 (opaque).
Align It is used to specify the vertical alignment of the label with respect to the node. This field takes the following values: top, middle, and bottom.
Allow Drag It is used to specify whether the node will be drag-able. Selecting this check-box will make the node drag-able (default), clearing it will not.
Shape It is used to specify the shape of the node. This field takes the following values: rectangle (default), circle, and polygon.
Height It is used to specify the height of the shape. This field is visible only when you have selected Rectangle from the Shape drop-down.
Width It is used to specify the width of the shape. This field is visible only when you have selected Rectangle from the Shape drop-down.
Radius It is used to specify the radius of the shape. This field is visible only when you have selected Circle or Polygon from the Shape drop-down.
Sides It is used to specify the number of sides for the shape. This field is visible only when you have selected Polygon from the Shape drop-down.
Link It is used to specify the URL to which the user will be redirected to if the node is clicked.
Image It is used to specify whether an image will be rendered with the node. Selecting this check box will make visible the fields that allow you to enter image information, clearing it will not render an image.
URL It is used to specify the URL to which the user will be redirected to, if the image is clicked. This field will be visible only if the Image check box is selected.
Width It is used to specify the width of the image. This field will be visible only if the Image check box is selected.
Height It is used to specify the height of the image. This field will be visible only if the Image check box is selected.
Align It is used to specify the alignment of the image with respect to the node. This attribute takes the following values: top, middle, and bottom. This field will be visible only if the Image check box is selected.

The image below shows the fields of the dialog box populated for a new node:

image add-node-image-4

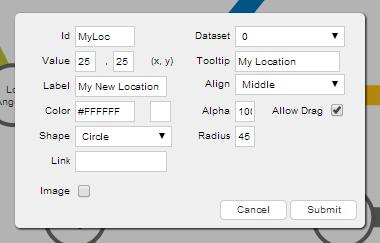
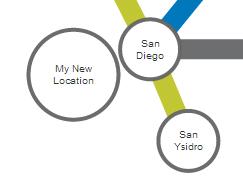
Now, when the Submit button is clicked, the new node created looks like this:

image add-node-image-5

You can define nodes in the chart data using the data object of the dataset object.

Event Raised

When a new node is created, a Javascript event, named nodeAdded, is raised. You can trap and use this event to customize the output according to your requirements.

The code snippet required to trap this event is given below:

1
2
3
chartInstance.addEventListener('nodeadded', function(e, a){
    //Your code here    
});

Editing a Node at Run-time

For a node, you can edit all its properties except for the ID and the dataset to which it belongs.

To edit a node:

  1. Press and hold the left mouse button on that node. The node properties dialog box is rendered with the Id and Dataset fields disabled.

  2. In this dialog box, re-populate the fields you want to edit.

  3. Click Submit.

The image below shows the fields of the dialog box re-populated for the node we created above:

image add-node-image-6

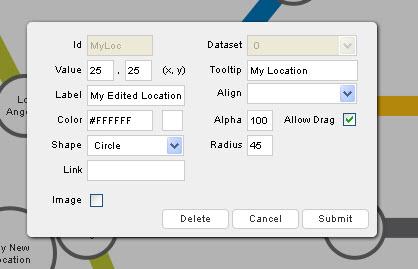
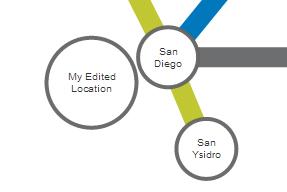
Now, when the Submit button is clicked, the edited node looks like this:

image add-node-image-7

Event Raised

When a node is edited, a Javascript event, named nodeUpdated, is raised. You can trap and use this event to customize the output according to your requirements.

The code snippet required to trap this event is given below:

1
2
3
chartInstance.addEventListener('nodeupdated', function(e, a){
    //Your code here    
});

Deleting a Node at Run-Time

To delete a node:

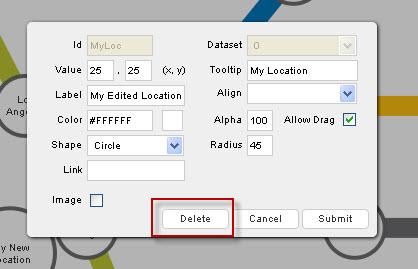
  1. Press and hold the left mouse button on the node that you want to delete. The node properties dialog box appears.

  2. From the dialog box, click Delete. The node is deleted.

image add-node-image-8

Event Raised

When a node is deleted, a Javascript event, named nodeDeleted, is raised. You can trap and use this event to customize the output according to your requirements.

The code snippet required to trap this event is given below:

1
2
3
chartInstance.addEventListener('nodedeleted', function(e, a){
    //Your code here    
});

You can get the latest updated node positions using JavaScript or by submitting the updated positions to a server-side script.

There! You have now seen how you can add, edit, and delete nodes at run-time.