Loading
Introduction to exporting charts as image and pdf
FusionCharts Suite XT uses JavaScript to render charts in the browser, using SVG and VML. It also allows to export the chart as an image or PDF using a server-side helper library to convert the SVG to image/PDF. VML can also be exported as it is internally converted to SVG before exporting. During the export, the data is sent to FusionCharts servers for processing and generating the image/PDF.
You must have an active internet connection for this feature to work. The formats currently supported for exporting are :
- JPG
- PNG
- SVG
Starting version 3.8.0, FusionCharts Suite XT has also enabled the client-side export feature. The client-side export feature removes the round-trip involved in exporting from a server while also addressing the data confidentiality issues that may arise from using a publicly hosted server.
When exporting is enabled, a drop down menu appears which allows selection from one of the above formats. You can select the desired format and the image/PDF gets downloaded to your machine.
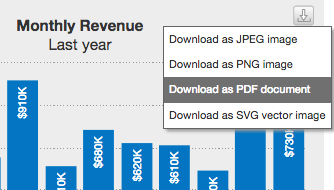
To enable server-side exporting, the chart level attribute exportEnabled needs to be assigned the value 1. This will make the export icon appear on the chart, which when clicked will show the dropdown menu for selecting the export type.
To enable client-side exporting, the exportAtClientSide attribute (also a chart level attribute) is set to 1.
The data structure to enable server-side exporting is shown below:
{
    "chart": {
        "caption": "Monthly Revenue",
        "subCaption": "Last year",
        "xAxisName": "Month",
        "yAxisName": "Amount (In USD)",
        "numberPrefix": "$",
        "canvasBgAlpha": "0",
        "bgColor": "#DDDDDD",
        "bgAlpha": "50",
        "theme": "fint",
        "exportEnabled": "1"
    },
    "data": [
        {
            "label": "Jan",
            "value": "420000"
        },
        {
            "label": "Feb",
            "value": "810000"
        },
        {
            "label": "Mar",
            "value": "720000"
        },
        {
            "label": "Apr",
            "value": "550000"
        },
        {
            "label": "May",
            "value": "910000"
        },
        {
            "label": "Jun",
            "value": "510000"
        },
        {
            "label": "Jul",
            "value": "680000"
        },
        {
            "label": "Aug",
            "value": "620000"
        },
        {
            "label": "Sep",
            "value": "610000"
        },
        {
            "label": "Oct",
            "value": "490000"
        },
        {
            "label": "Nov",
            "value": "900000"
        },
        {
            "label": "Dec",
            "value": "730000"
        }
    ]
}
In case you want to process the export data on your own server, you can configure one of the export handlers by following the Setup Private Export Server guide.