The Gantt chart is a specialized chart used for displaying various timelines like project timelines, development timelines etc. It can be used for any of the following:
- Planning and scheduling projects.
- Assessing how long a project should take.
- Laying out the order in which tasks need to be carried out.
- Managing dependencies between tasks.
- Determining the resources needed.
In short, Gantt chart help you monitor progress of a project. You can immediately see what should have been achieved at a point in time. Also, they allow you to judge how remedial action may bring the project back on course, if it's running off the track.
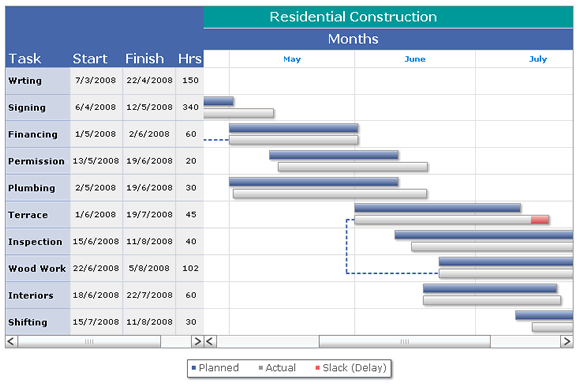
FusionWidgets XT Gantt chart is a date/time based Gantt chart that allows you to plot the tasks visually, i.e., for each task you’ll have to provide the exact start and end date/time.
A typical FusionWidgets XT Gantt chart looks as under:
FusionWidgets XT Gantt chart offers you the following features:
- Supports both date & time display.
- Multiple and irregular division of dates on the visual timeline. The categories can have custom labels, cosmetics and can even be linked.
- Customizable input & output date format. As such, you can opt to provide dates in XML in one format and then customize the output format. Additionally, the output format supports extensive customization of date format.
- Ability to show each task’s completion in percentage as either empty bar or using a different fill color (slack fill color)
- Ability to show a scrollable data table at the side of Gantt chart. This data table can have any number of columns containing any data that you wish to show. The cells of this table can be linked to external links. You can customize the cosmetics of each cell of this table.
- Ability to restrict the Gantt view pane area to a specified date/time duration. The rest can be viewed upon scrolling of the chart.
- Tasks are linked to processes by ID. As such, multiple tasks can be defined for each process. This helps in cases like where you’re plotting a Gantt chart indicating allotted work for all team members and each member has multiple jobs allotted during the same period.
- Option to show/hide task labels, percent labels, individual task bar dates etc.
- Ability to show individual task bars as groups – to indicate task groups.
- Customizable connectors to connect any 2 tasks on the chart. The connectors can be connected to either start or end of both the tasks and as such be rendered in 4 different ways. The cosmetics of each connector can be individually customized.
- Ability to display milestones at specified dates. Milestones can be displayed as polygons or stars with customizable properties. You can show additional tool text for milestones or link them to external links.
- Trend-lines or trend-zones can be added to the chart to highlight a single date or a range of dates. E.g., trend line can be added to show “Today”, or trend-zones can be added to show “Holiday” etc.
- Customizable tooltip properties – also, you can opt to show task date as part of tooltip content.
- Ability to add a legend to the chart to show color keys. Fully customizable legend cosmetics.
- Ability to define each task’s height and top-padding in percentage, instead of just pixels.
- Pre-defined palettes and single color theme selectors to help you easily set colors for the chart.
- You can define the width ratio in which the data table and Gantt area is to be distributed.
- Animated task bars with customizable animation properties.
- Fully customizable Gantt & grid cosmetics. Various other cosmetics can be customized like scroll properties etc.
- Round edged task bars supported
- Customizable gradient mix & shadow for task bars.
- Ability to define annotations over the Gantt chart to show further information.
- Styles support for almost all objects on the chart.
- Hovering effect enabled in JavaScript chart only. Customizable hovering properties for categories, processes, connectors and task bars are available.
- Vertical Scrolling supported in JavaScript chart.
Let’s now move on to study the anatomy of a Gantt chart.