FusionWidgets XT Gantt chart support scrolling for both the data table and the Gantt view pane. Here, we'll see how to enable and configure them. Specifically, we'll be looking at the following:
- Enable scroll for data table
- Enable scroll for Gantt pane
- Configure scroll properties
- Scroll to a particular date
- Vertical scrolling
Let's see them one by one.
<chart dateFormat="mm/dd/yyyy" caption="Project Gantt" subCaption="From 1st Feb 2007 - 31st Aug 2007">
  <categories>
    <category start="02/01/2007" end="04/01/2007" label="Q1"/>
    <category start="04/01/2007" end="07/01/2007" label="Q2"/>
    <category start="07/01/2007" end="09/01/2007" label="Q3"/>
  </categories>
  <categories>
    <category start="02/01/2007" end="03/01/2007" label="Feb"/>
    <category start="03/01/2007" end="04/01/2007" label="Mar"/>
    <category start="04/01/2007" end="05/01/2007" label="Apr"/>
    <category start="05/01/2007" end="06/01/2007" label="May"/>
    <category start="06/01/2007" end="07/01/2007" label="Jun"/>
    <category start="07/01/2007" end="08/01/2007" label="Jul"/>
    <category start="08/01/2007" end="09/01/2007" label="Aug"/>
  </categories>
  <processes fontSize="12" isBold="1" align="right">
    <process label="Identify Customers"/>
    <process label="Survey 50 Customers"/>
    <process label="Interpret Requirements"/>
    <process label="Study Competition"/>
    <process label="Documentation of features"/>
    <process label="Brainstorm concepts"/>
    <process label="Design & Code"/>
    <process label="Testing / QA"/>
    <process label="Documentation of product"/>
    <process label="Global Release"/>
  </processes>
  <datatable headerVAlign="bottom">
    <datacolumn headerText="Who does?" headerFontSize="18" headerVAlign="bottom" headerAlign="right" align="left" fontSize="12">
      <text label="John"/>
      <text label="David"/>
      <text label="Mary"/>
      <text label="Andrew"/>
      <text label="Tiger"/>
      <text label="Sharon"/>
      <text label="Neil"/>
      <text label="Harry"/>
      <text label="Chris"/>
      <text label="Richard"/>
    </datacolumn>
  </datatable>
  <tasks>
    <task start="02/04/2007" end="02/10/2007"/>
    <task start="02/08/2007" end="02/19/2007"/>
    <task start="02/19/2007" end="03/02/2007"/>
    <task start="02/24/2007" end="03/02/2007"/>
    <task start="03/02/2007" end="03/21/2007"/>
    <task start="03/21/2007" end="04/06/2007"/>
    <task start="04/06/2007" end="07/21/2007"/>
    <task start="07/21/2007" end="08/19/2007"/>
    <task start="07/28/2007" end="08/24/2007"/>
    <task start="08/24/2007" end="08/27/2007"/>
  </tasks>
</chart>
{
  "chart": {
    "dateformat": "mm/dd/yyyy",
    "caption": "Project Gantt",
    "subcaption": "From 1st Feb 2007 - 31st Aug 2007"
  },
  "categories": [
    {
      "category": [
        {
          "start": "02/01/2007",
          "end": "04/01/2007",
          "label": "Q1"
        },
        {
          "start": "04/01/2007",
          "end": "07/01/2007",
          "label": "Q2"
        },
        {
          "start": "07/01/2007",
          "end": "09/01/2007",
          "label": "Q3"
        }
      ]
    },
    {
      "category": [
        {
          "start": "02/01/2007",
          "end": "03/01/2007",
          "label": "Feb"
        },
        {
          "start": "03/01/2007",
          "end": "04/01/2007",
          "label": "Mar"
        },
        {
          "start": "04/01/2007",
          "end": "05/01/2007",
          "label": "Apr"
        },
        {
          "start": "05/01/2007",
          "end": "06/01/2007",
          "label": "May"
        },
        {
          "start": "06/01/2007",
          "end": "07/01/2007",
          "label": "Jun"
        },
        {
          "start": "07/01/2007",
          "end": "08/01/2007",
          "label": "Jul"
        },
        {
          "start": "08/01/2007",
          "end": "09/01/2007",
          "label": "Aug"
        }
      ]
    }
  ],
  "processes": {
    "fontsize": "12",
    "isbold": "1",
    "align": "right",
    "process": [
      {
        "label": "Identify Customers"
      },
      {
        "label": "Survey 50 Customers"
      },
      {
        "label": "Interpret Requirements"
      },
      {
        "label": "Study Competition"
      },
      {
        "label": "Documentation of features"
      },
      {
        "label": "Brainstorm concepts"
      },
      {
        "label": "Design & Code"
      },
      {
        "label": "Testing / QA"
      },
      {
        "label": "Documentation of product"
      },
      {
        "label": "Global Release"
      }
    ]
  },
  "datatable": {
    "headervalign": "bottom",
    "datacolumn": [
      {
        "headertext": "Who does?",
        "headerfontsize": "18",
        "headervalign": "bottom",
        "headeralign": "right",
        "align": "left",
        "fontsize": "12",
        "text": [
          {
            "label": "John"
          },
          {
            "label": "David"
          },
          {
            "label": "Mary"
          },
          {
            "label": "Andrew"
          },
          {
            "label": "Tiger"
          },
          {
            "label": "Sharon"
          },
          {
            "label": "Neil"
          },
          {
            "label": "Harry"
          },
          {
            "label": "Chris"
          },
          {
            "label": "Richard"
          }
        ]
      }
    ]
  },
  "tasks": {
    "task": [
      {
        "start": "02/04/2007",
        "end": "02/10/2007"
      },
      {
        "start": "02/08/2007",
        "end": "02/19/2007"
      },
      {
        "start": "02/19/2007",
        "end": "03/02/2007"
      },
      {
        "start": "02/24/2007",
        "end": "03/02/2007"
      },
      {
        "start": "03/02/2007",
        "end": "03/21/2007"
      },
      {
        "start": "03/21/2007",
        "end": "04/06/2007"
      },
      {
        "start": "04/06/2007",
        "end": "07/21/2007"
      },
      {
        "start": "07/21/2007",
        "end": "08/19/2007"
      },
      {
        "start": "07/28/2007",
        "end": "08/24/2007"
      },
      {
        "start": "08/24/2007",
        "end": "08/27/2007"
      }
    ]
  }
}
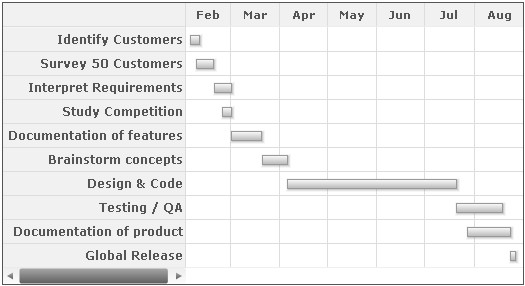
As you can see above, the scroll bar for data-grid automatically becomes active when the data in grid cannot fit itself in one screen.
To disable the scrollbar for data-grid, you've 3 options:
- Increase chart width so that the data-grid fits in fully in one screen
- Set <chart ganttWidthPercent='0-100' > to a lower value. This attribute indicates the percent space (width) the Gantt pane takes. If the Gantt takes lesser space, the grid will get more space and as such might fit in the full labels.
- Set <chart showFullDataTable='0' ..> This asks the chart to wrap & truncate the data labels and try to squeeze them in the required space (only if possible).
By default, the Gantt pane never automatically scrolls, unless you explicitly specify it. To enable scrolling for the Gantt pane, you'll first need to decide the following - "What time frame should be visible in one screen of the Gantt pane?" Once this is decided and specified for the chart, the rest of time frame is shown upon scrolling. For example, you may decide that instead of showing all data at once, you just want to see any 3 month's data only in 1 screen. As such, you'll need to specify:
This tells the chart to set the Gantt pane duration as 3 months. And, the chart now looks as under:
As you can see above, the chart now shows only 3 months data in the Gantt pane - the rest can be viewed upon scrolling.
ganttPaneDurationUnit can take the following values:
| Value | What it represents? |
| y | How many years to display? |
| m | How many months to display? |
| d | How many days to display? |
| h | How many hours to display? |
| mn | How many minutes to display? |
| s | How many seconds to display? |
FusionWidgets XT allows you to completely configure the scroll bar cosmetics.
To change the scroll bar color, you can use:
This changes the scroll bar to something as under:
You can also increase its height, padding, button width etc. using:
This gives a result as under:
Starting FusionWidgets XT v3.3.1, you can set the date from which the chart will initially render. You can do so by using the scrollToDate attribute.
Note: The scroll to date feature is only available in JavaScript Gantt chart.
If you wish a Gantt chart to scroll to a particular date when it is rendered, you need to set:
In the above code we've specified the particular date from where the chart will initially render. A chart with the above data is shown below:
Note: In order to scroll to a particular date you first need to enable scrolling.
Starting FusionWidgets XT v3.3.1, vertical scrolling has been introduced for the Gantt view pane in JavaScript Gantt chart.
Note: The vertical scrolling is not applicable in Flash Gantt chart.
Vertical scrolling is enabled by default depending on the height of the chart. If the number of processes fits within the height of the chart, vertical scrolling will not appear. To disable vertical scrolling, you need to set the following:
A Gantt chart without vertical scrolling appears as shown in the image below:
When vertical scrolling is disabled the number of processes fits within the available space. The image below displays a Gantt chart without vertical scrolling: