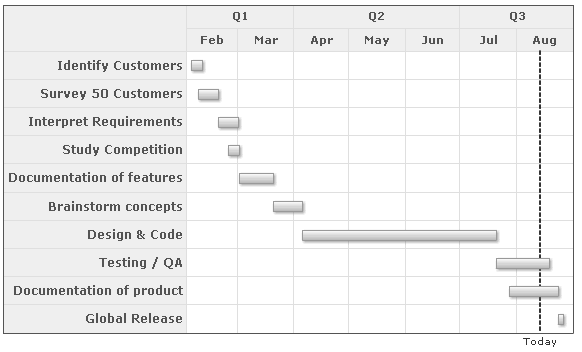
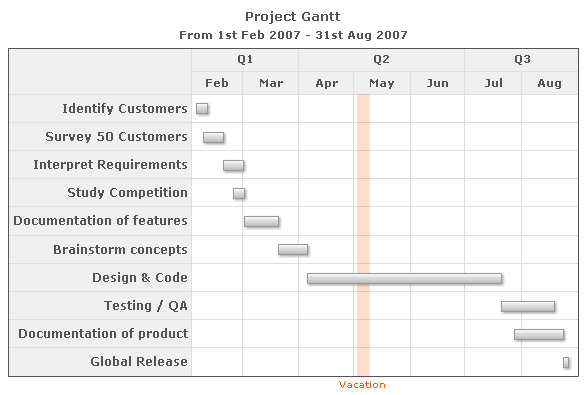
FusionWidgets XT Gantt chart allows you to add trend lines and trend zones to your Gantt chart. These are helpful when you want to show an event for a particular date - like say, you want to draw a line for "Today" or color the vacations. Here, we'll see how to:
<chart dateFormat="mm/dd/yyyy" caption="Project Gantt" subCaption="From 1st Feb 2007 - 31st Aug 2007">
  <categories>
    <category start="02/01/2007" end="04/01/2007" label="Q1"/>
    <category start="04/01/2007" end="07/01/2007" label="Q2"/>
    <category start="07/01/2007" end="09/01/2007" label="Q3"/>
  </categories>
  <categories>
    <category start="02/01/2007" end="03/01/2007" label="Feb"/>
    <category start="03/01/2007" end="04/01/2007" label="Mar"/>
    <category start="04/01/2007" end="05/01/2007" label="Apr"/>
    <category start="05/01/2007" end="06/01/2007" label="May"/>
    <category start="06/01/2007" end="07/01/2007" label="Jun"/>
    <category start="07/01/2007" end="08/01/2007" label="Jul"/>
    <category start="08/01/2007" end="09/01/2007" label="Aug"/>
  </categories>
  <processes fontSize="12" isBold="1" align="right">
    <process label="Identify Customers"/>
    <process label="Survey 50 Customers"/>
    <process label="Interpret Requirements"/>
    <process label="Study Competition"/>
    <process label="Documentation of features"/>
    <process label="Brainstorm concepts"/>
    <process label="Design & Code"/>
    <process label="Testing / QA"/>
    <process label="Documentation of product"/>
    <process label="Global Release"/>
  </processes>
  <tasks>
    <task start="02/04/2007" end="02/10/2007"/>
    <task start="02/08/2007" end="02/19/2007"/>
    <task start="02/19/2007" end="03/02/2007"/>
    <task start="02/24/2007" end="03/02/2007"/>
    <task start="03/02/2007" end="03/21/2007"/>
    <task start="03/21/2007" end="04/06/2007"/>
    <task start="04/06/2007" end="07/21/2007"/>
    <task start="07/21/2007" end="08/19/2007"/>
    <task start="07/28/2007" end="08/24/2007"/>
    <task start="08/24/2007" end="08/27/2007"/>
  </tasks>
  <trendlines>
    <line start="08/14/2007" displayValue="Today" color="333333" thickness="2" dashed="1"/>
  </trendlines>
</chart>
{
  "chart": {
    "dateformat": "mm/dd/yyyy",
    "caption": "Project Gantt",
    "subcaption": "From 1st Feb 2007 - 31st Aug 2007"
  },
  "categories": [
    {
      "category": [
        {
          "start": "02/01/2007",
          "end": "04/01/2007",
          "label": "Q1"
        },
        {
          "start": "04/01/2007",
          "end": "07/01/2007",
          "label": "Q2"
        },
        {
          "start": "07/01/2007",
          "end": "09/01/2007",
          "label": "Q3"
        }
      ]
    },
    {
      "category": [
        {
          "start": "02/01/2007",
          "end": "03/01/2007",
          "label": "Feb"
        },
        {
          "start": "03/01/2007",
          "end": "04/01/2007",
          "label": "Mar"
        },
        {
          "start": "04/01/2007",
          "end": "05/01/2007",
          "label": "Apr"
        },
        {
          "start": "05/01/2007",
          "end": "06/01/2007",
          "label": "May"
        },
        {
          "start": "06/01/2007",
          "end": "07/01/2007",
          "label": "Jun"
        },
        {
          "start": "07/01/2007",
          "end": "08/01/2007",
          "label": "Jul"
        },
        {
          "start": "08/01/2007",
          "end": "09/01/2007",
          "label": "Aug"
        }
      ]
    }
  ],
  "processes": {
    "fontsize": "12",
    "isbold": "1",
    "align": "right",
    "process": [
      {
        "label": "Identify Customers"
      },
      {
        "label": "Survey 50 Customers"
      },
      {
        "label": "Interpret Requirements"
      },
      {
        "label": "Study Competition"
      },
      {
        "label": "Documentation of features"
      },
      {
        "label": "Brainstorm concepts"
      },
      {
        "label": "Design & Code"
      },
      {
        "label": "Testing / QA"
      },
      {
        "label": "Documentation of product"
      },
      {
        "label": "Global Release"
      }
    ]
  },
  "tasks": {
    "task": [
      {
        "start": "02/04/2007",
        "end": "02/10/2007"
      },
      {
        "start": "02/08/2007",
        "end": "02/19/2007"
      },
      {
        "start": "02/19/2007",
        "end": "03/02/2007"
      },
      {
        "start": "02/24/2007",
        "end": "03/02/2007"
      },
      {
        "start": "03/02/2007",
        "end": "03/21/2007"
      },
      {
        "start": "03/21/2007",
        "end": "04/06/2007"
      },
      {
        "start": "04/06/2007",
        "end": "07/21/2007"
      },
      {
        "start": "07/21/2007",
        "end": "08/19/2007"
      },
      {
        "start": "07/28/2007",
        "end": "08/24/2007"
      },
      {
        "start": "08/24/2007",
        "end": "08/27/2007"
      }
    ]
  },
  "trendlines": [
    {
      "line": [
        {
          "start": "08/14/2007",
          "displayvalue": "Today",
          "color": "333333",
          "thickness": "2",
          "dashed": "1"
        }
      ]
    }
  ]
}
As you can see above, we've added the trendline under the <trendlines> element. All trend lines of the chart need to be defined within this element.
Each trend line on the chart is represented by <line> element and can have a number of attributes. Here, we've used:
- The start attribute to indicate the start date of trend line. If you're using trend zones (explained below), then you'll need to specify the end attribute too. Also, end attribute can be used if you want a slanted trend line.
- The displayValue attribute to specify the label for the trend line.
- Various cosmetic properties, which have been discussed in detail in the Chart XML Sheet.
<chart dateFormat="mm/dd/yyyy" caption="Project Gantt" subCaption="From 1st Feb 2007 - 31st Aug 2007">
  <categories>
    <category start="02/01/2007" end="04/01/2007" label="Q1"/>
    <category start="04/01/2007" end="07/01/2007" label="Q2"/>
    <category start="07/01/2007" end="09/01/2007" label="Q3"/>
  </categories>
  <categories>
    <category start="02/01/2007" end="03/01/2007" label="Feb"/>
    <category start="03/01/2007" end="04/01/2007" label="Mar"/>
    <category start="04/01/2007" end="05/01/2007" label="Apr"/>
    <category start="05/01/2007" end="06/01/2007" label="May"/>
    <category start="06/01/2007" end="07/01/2007" label="Jun"/>
    <category start="07/01/2007" end="08/01/2007" label="Jul"/>
    <category start="08/01/2007" end="09/01/2007" label="Aug"/>
  </categories>
  <processes fontSize="12" isBold="1" align="right">
    <process label="Identify Customers"/>
    <process label="Survey 50 Customers"/>
    <process label="Interpret Requirements"/>
    <process label="Study Competition"/>
    <process label="Documentation of features"/>
    <process label="Brainstorm concepts"/>
    <process label="Design & Code"/>
    <process label="Testing / QA"/>
    <process label="Documentation of product"/>
    <process label="Global Release"/>
  </processes>
  <tasks>
    <task start="02/04/2007" end="02/10/2007"/>
    <task start="02/08/2007" end="02/19/2007"/>
    <task start="02/19/2007" end="03/02/2007"/>
    <task start="02/24/2007" end="03/02/2007"/>
    <task start="03/02/2007" end="03/21/2007"/>
    <task start="03/21/2007" end="04/06/2007"/>
    <task start="04/06/2007" end="07/21/2007"/>
    <task start="07/21/2007" end="08/19/2007"/>
    <task start="07/28/2007" end="08/24/2007"/>
    <task start="08/24/2007" end="08/27/2007"/>
  </tasks>
  <trendlines>
    <line start="05/3/2007" end="05/10/2007" displayValue="Vacation" isTrendZone="1" alpha="20" color="FF5904"/>
  </trendlines>
</chart>
{
  "chart": {
    "dateformat": "mm/dd/yyyy",
    "caption": "Project Gantt",
    "subcaption": "From 1st Feb 2007 - 31st Aug 2007"
  },
  "categories": [
    {
      "category": [
        {
          "start": "02/01/2007",
          "end": "04/01/2007",
          "label": "Q1"
        },
        {
          "start": "04/01/2007",
          "end": "07/01/2007",
          "label": "Q2"
        },
        {
          "start": "07/01/2007",
          "end": "09/01/2007",
          "label": "Q3"
        }
      ]
    },
    {
      "category": [
        {
          "start": "02/01/2007",
          "end": "03/01/2007",
          "label": "Feb"
        },
        {
          "start": "03/01/2007",
          "end": "04/01/2007",
          "label": "Mar"
        },
        {
          "start": "04/01/2007",
          "end": "05/01/2007",
          "label": "Apr"
        },
        {
          "start": "05/01/2007",
          "end": "06/01/2007",
          "label": "May"
        },
        {
          "start": "06/01/2007",
          "end": "07/01/2007",
          "label": "Jun"
        },
        {
          "start": "07/01/2007",
          "end": "08/01/2007",
          "label": "Jul"
        },
        {
          "start": "08/01/2007",
          "end": "09/01/2007",
          "label": "Aug"
        }
      ]
    }
  ],
  "processes": {
    "fontsize": "12",
    "isbold": "1",
    "align": "right",
    "process": [
      {
        "label": "Identify Customers"
      },
      {
        "label": "Survey 50 Customers"
      },
      {
        "label": "Interpret Requirements"
      },
      {
        "label": "Study Competition"
      },
      {
        "label": "Documentation of features"
      },
      {
        "label": "Brainstorm concepts"
      },
      {
        "label": "Design & Code"
      },
      {
        "label": "Testing / QA"
      },
      {
        "label": "Documentation of product"
      },
      {
        "label": "Global Release"
      }
    ]
  },
  "tasks": {
    "task": [
      {
        "start": "02/04/2007",
        "end": "02/10/2007"
      },
      {
        "start": "02/08/2007",
        "end": "02/19/2007"
      },
      {
        "start": "02/19/2007",
        "end": "03/02/2007"
      },
      {
        "start": "02/24/2007",
        "end": "03/02/2007"
      },
      {
        "start": "03/02/2007",
        "end": "03/21/2007"
      },
      {
        "start": "03/21/2007",
        "end": "04/06/2007"
      },
      {
        "start": "04/06/2007",
        "end": "07/21/2007"
      },
      {
        "start": "07/21/2007",
        "end": "08/19/2007"
      },
      {
        "start": "07/28/2007",
        "end": "08/24/2007"
      },
      {
        "start": "08/24/2007",
        "end": "08/27/2007"
      }
    ]
  },
  "trendlines": [
    {
      "line": [
        {
          "start": "05/3/2007",
          "end": "05/10/2007",
          "displayvalue": "Vacation",
          "istrendzone": "1",
          "alpha": "20",
          "color": "FF5904"
        }
      ]
    }
  ]
}